Rasterizer - From a naive implementation to an optimized version
Creation and optimization of a hand-made rasterizer.
Contextualisation
During my second year of bachelor’s degree in Game Programming, one of the modules we studied was about optimization; What tools we had to measure, profile, understand and in the end optimize our programs for them to be more efficient and use less energy to be run.
For that module, after discussions with some of my colleagues, I decided to implement a CPU based Rasterizer. First of all because I wanted to anticipate the next module (computer graphics) and understand some basic concepts before really getting into it. Secondly I wanted to do a significant project where there would be interesting algorithms to implement and multiple possible ways of optimizing it. And finally, I wanted to do a project that would not only looks good but also give me a real understanding of how simple optimization principles could really change the effectiveness of a program by orders of magnitude.
The first step
My first step was to understand what a rasterizer is. To do so I went on Wikipedia and read about it. Once that was done, I had to figure out what were the necessary components I had to code to have a correct structure. From object loading to camera, scene, rasterization and finally file writing, all the elements required in the graphical pipeline to transform 3D objects into a 2D image.
Since I did not want to waste time reinventing what had already been invented, I searched for references, projects that would help me understand how to implement a rasterizer. Without too much effort, I stumbled upon this Rasterizer project made by Tayfun Kayhan that was exactly what I was looking for: a simple rasterizer project that went step by step from rasterizing a triangle to an entire scene.
The first implementation
Since I did not have any knowledge except my Wikipedia readings, I decided to follow the tutorial from A to Z.
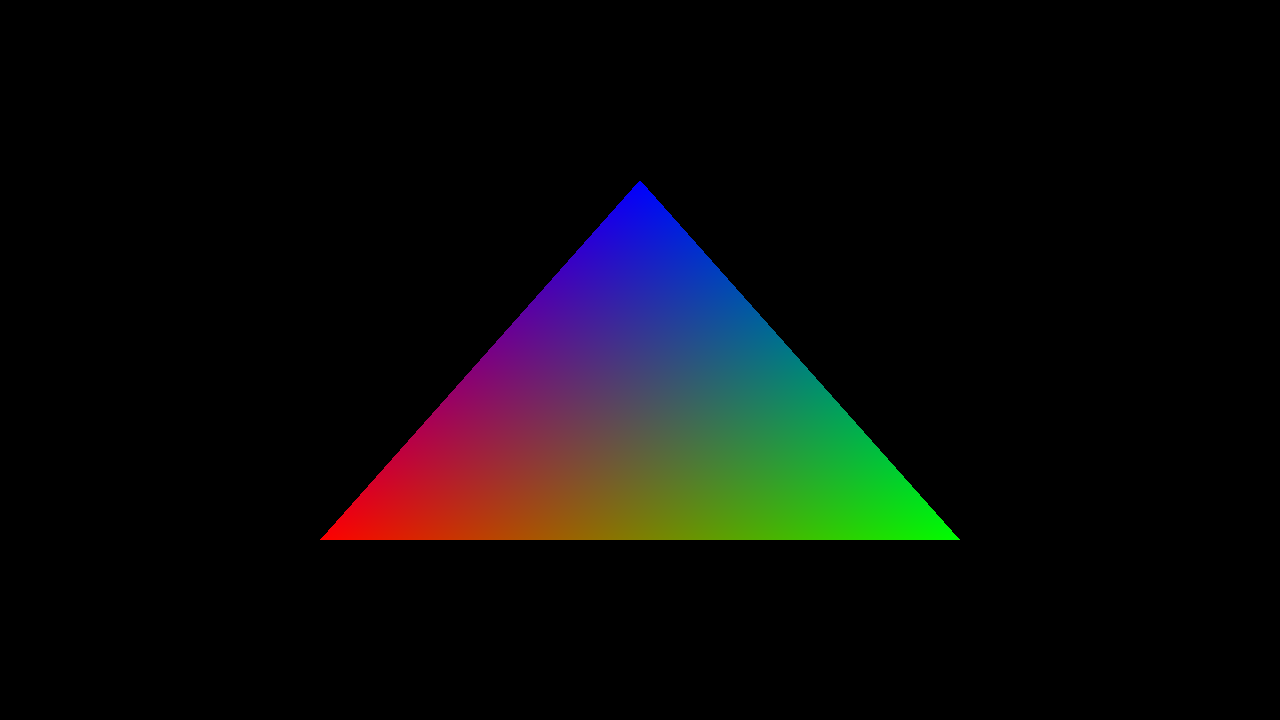
I first implemented the simplified version of the rasterizer called Hello, Triangle!, in that part I rendered a simple triangle.
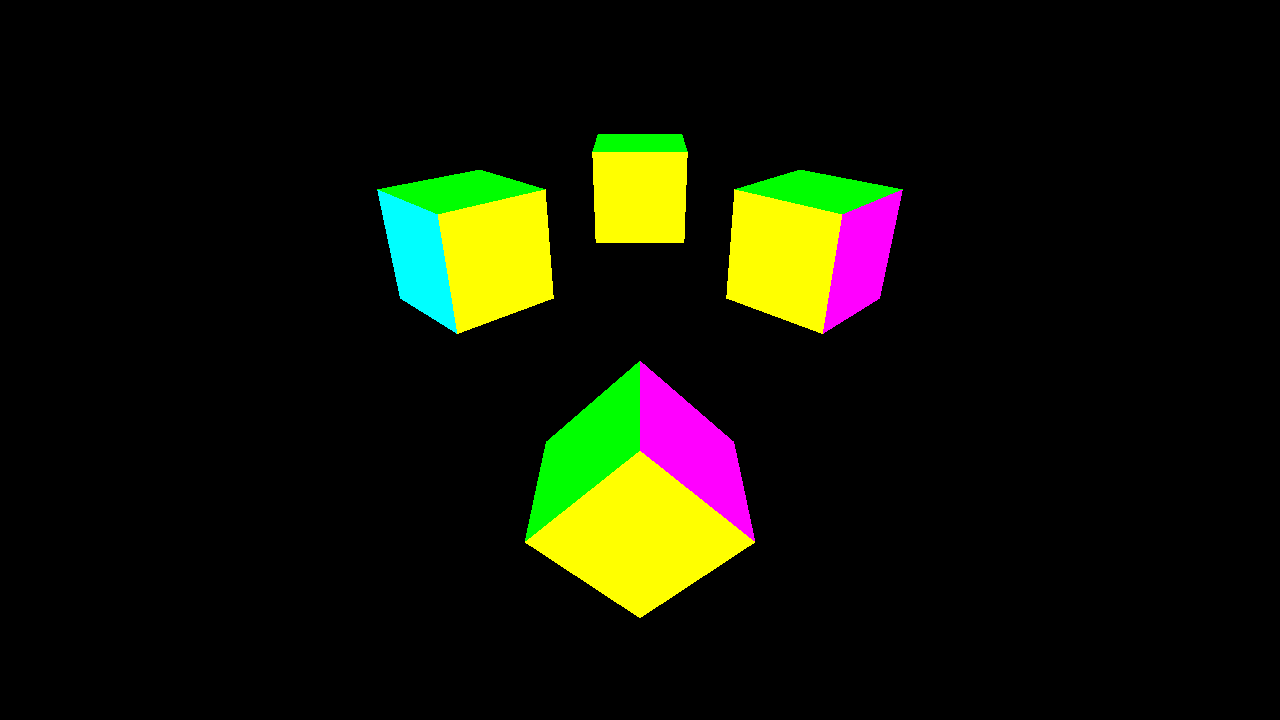
Then the second part Go 3D that introduced all the concepts relative to 3D space.
And finally, the last part Go Wild! that in terms allowed me to add elements such as loading objects and handling textures.
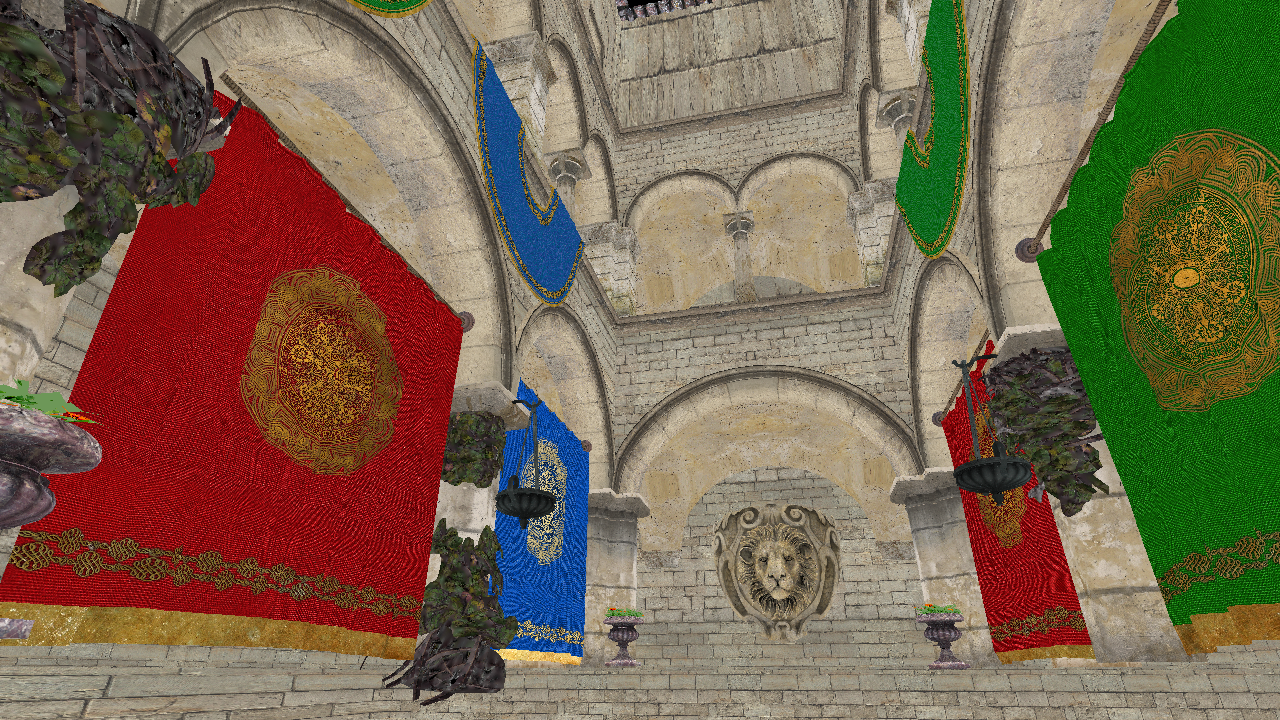
One of the objects I added to the project was The survival guitar backpack to test my rasterizer on a slightly more complex object than a cube. Further on I’ll refer to it as “The backpack”.
Code modernization
Once I had finished the tutorial, I decided (my teacher forced me) to modernize the given code from the tutorial so that it would no longer be C like code but actual C++. To do so, I changed all the macros into functions and clearly separated all the code into classes (.cpp & .hpp files) that held their own logic and thus where responsible for their own part of the program.
With that modification it was not only clearer to understand but also to modify and optimize since I could target the parts of my program I wanted to focus on.
First step into optimization
During our courses, we were introduced to multiple tools that could help us test and analyse our programs such as Google Test, Google Benchmarks, Intel VTune and Tracy.
We also discovered principles such as multithreading and job systems, SIMD or GPGPU that would help us optimize our programs.
In my case, optimizations regarding the GPU usage could have been useful but I wanted to do a CPU only Rasterizer so I voluntarily discarded GPU optimizations.
As I wanted to have an idea of the execution time of my program, I used #include <chrono> to implement a timer like so:
1
2
3
4
5
6
7
auto start = std::chrono::high_resolution_clock::now();
{
  //Block we want to measure
}
auto end = std::chrono::high_resolution_clock::now();
auto duration = std::chrono::duration_cast<std::chrono::milliseconds>(end - start)/1000.0f;
std::cout << duration.count() << " seconds" << std::endl;
With this simple measurement I was able to have a rough idea of the time my program took.
So, after that, I started my optimization journey by implementing unit tests in my code using Google Test and then Tracy so that I could visually see and analyse where the bottlenecks in my program were.
OMP Multi Threading
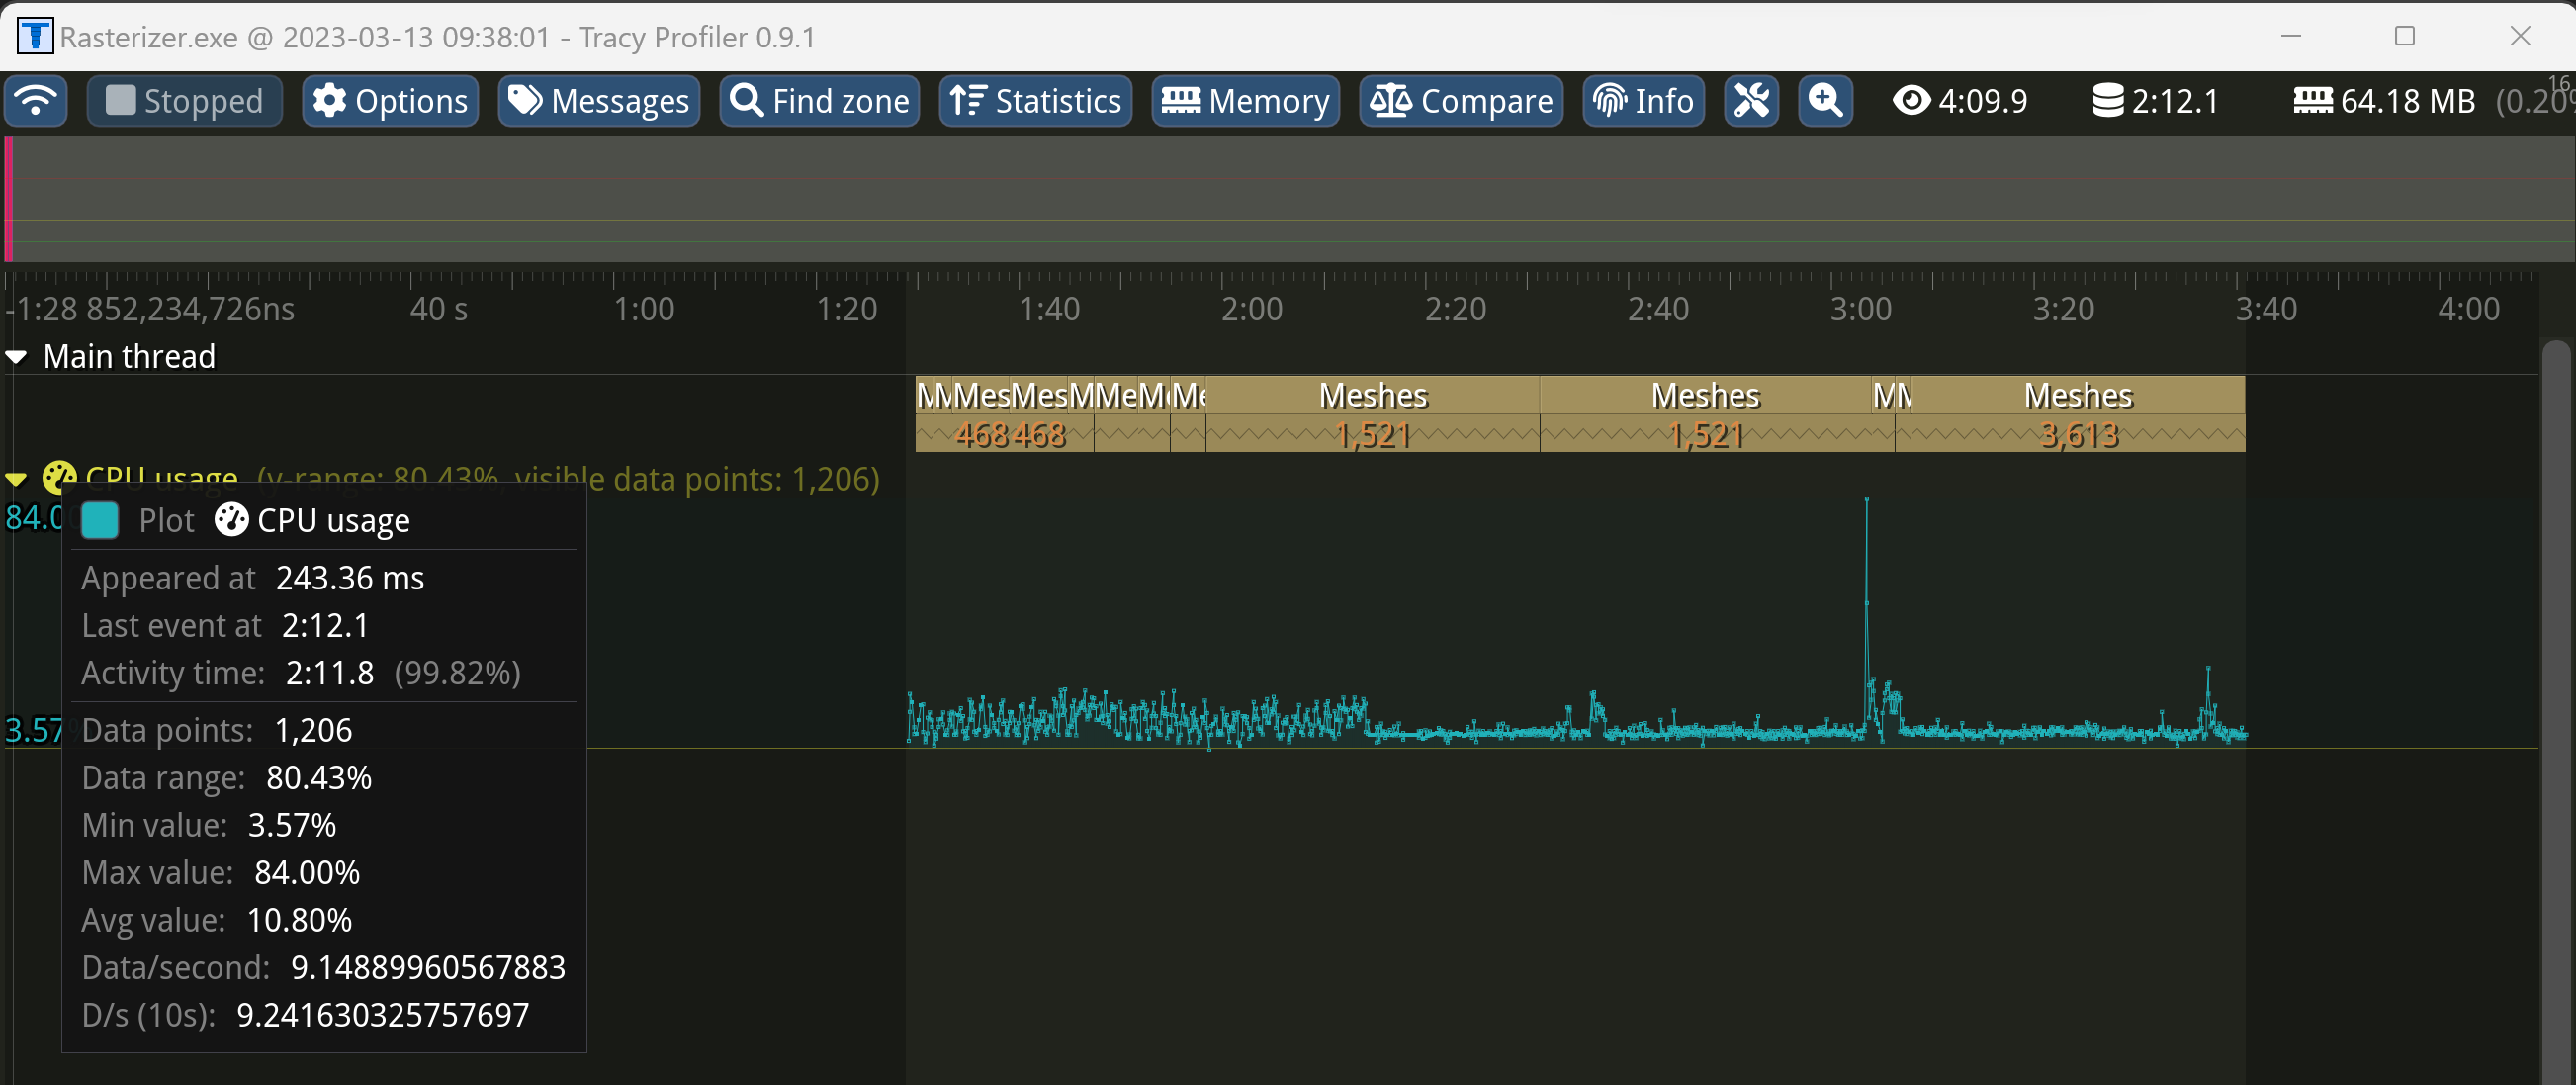
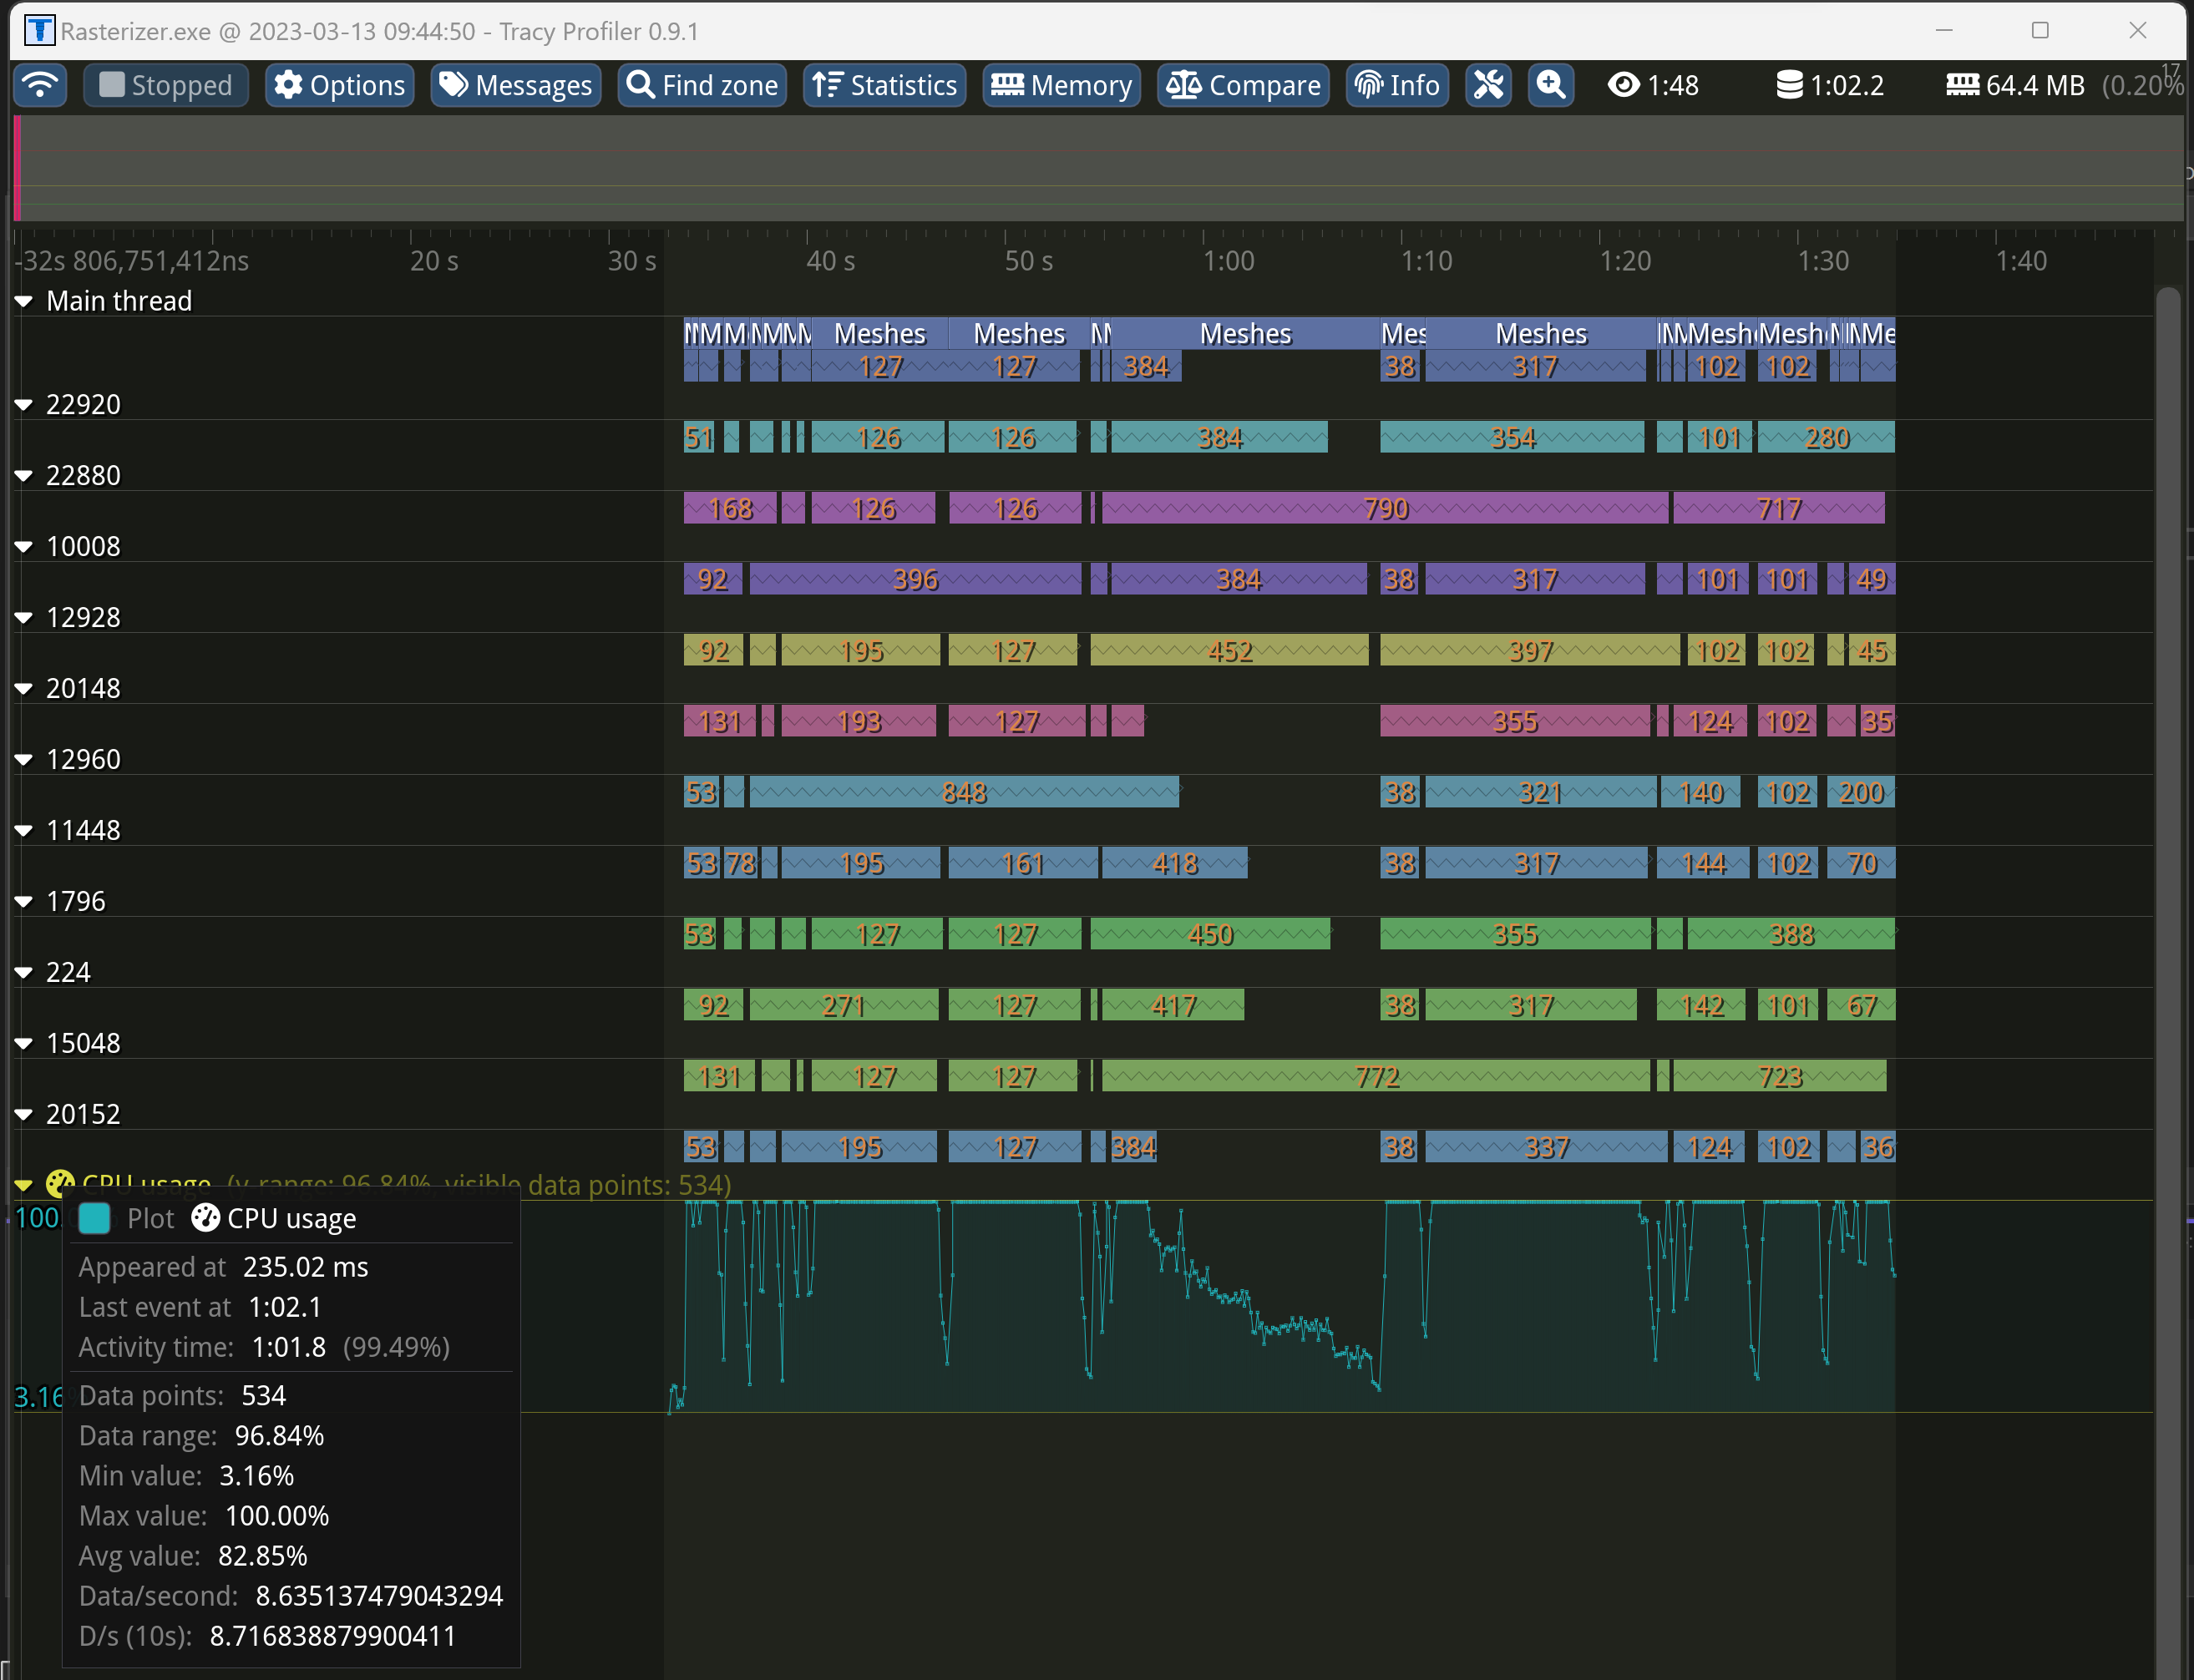
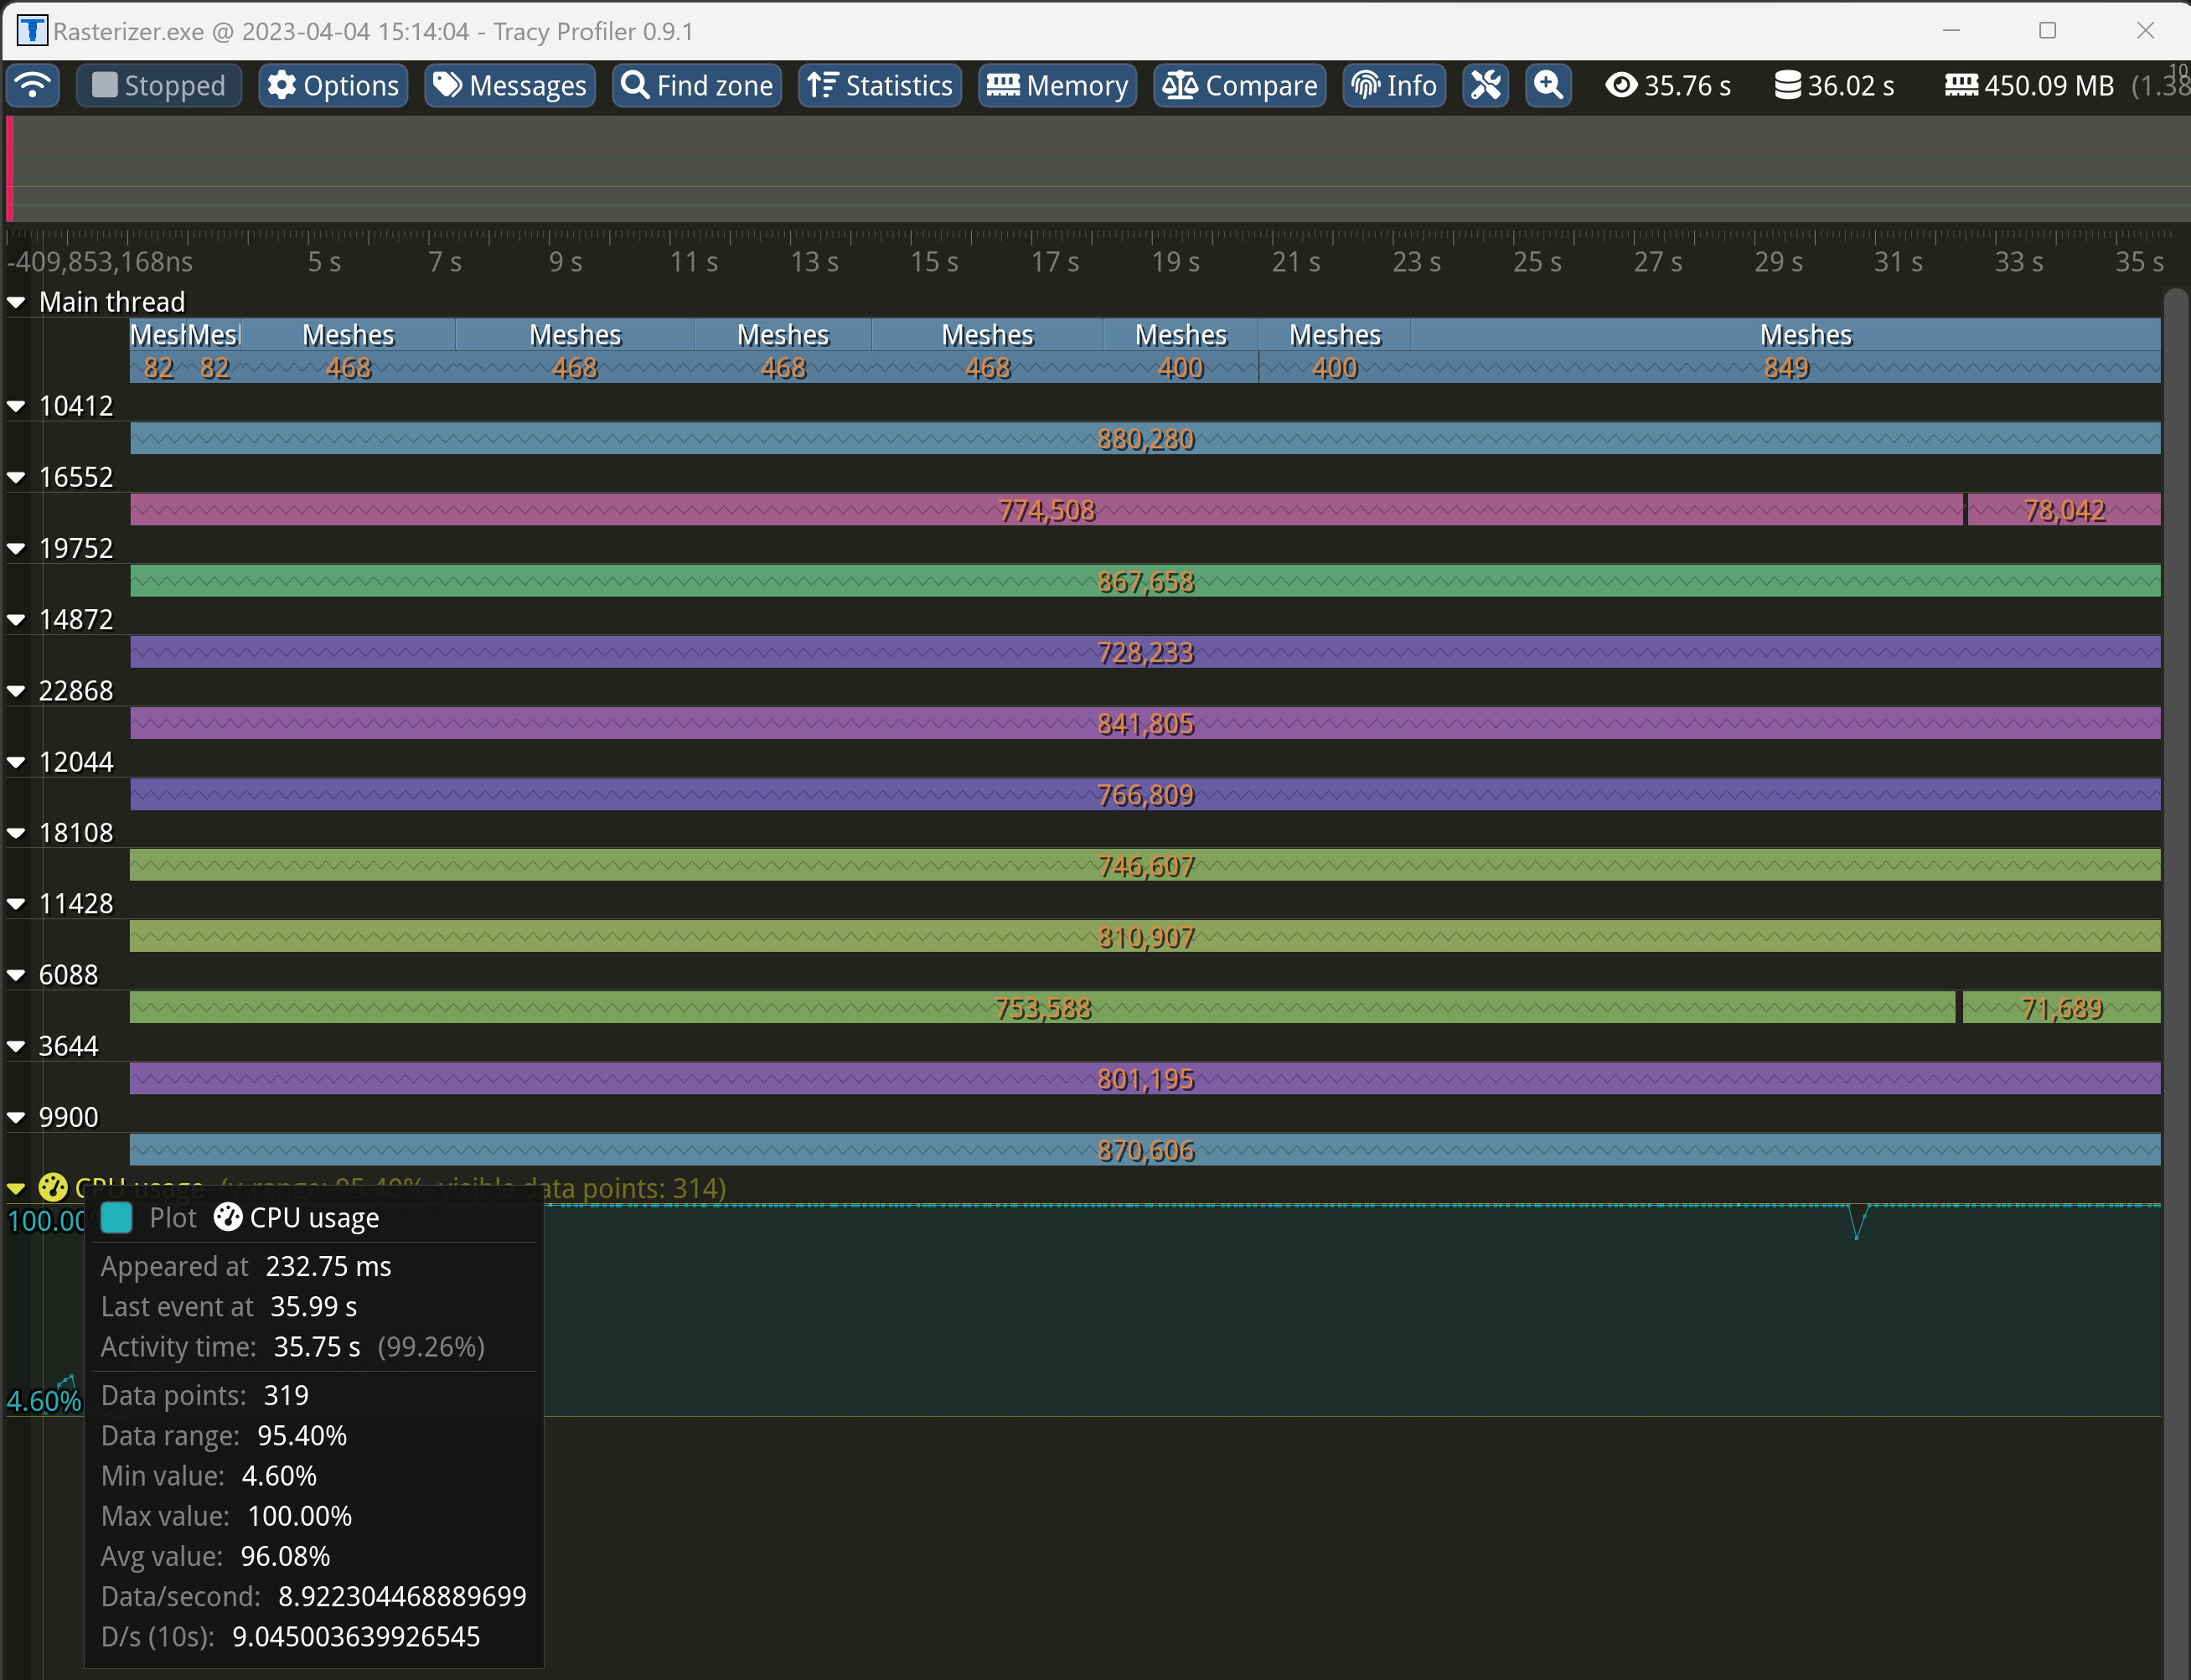
The first noticeable point was the fact that my program was only using one CPU thread. At that point I already knew and did not need to actually see it but still, I was happy to see the results Tracy gave me.
So, after some research I stumbled upon OpenMP, basically a library that enables multithreading with simple #pragmas, the result was not only nice to see in Tracy but would turn out to be really effective.
As you can see my program went from using a unique core of my CPU (Main thread) to using the 6 cores available (12 threads, main thread + 11 threads). I could already see a significant improvement to my program. For a given Scene (Dubrovnik’s Sponza Palace, Resolution: 7680x4320) It went from approximatively 65 hours to 81 minutes.
With a simple #pragma omp parallel for I parallelized the triangles calculation and my program improved by approximatively 48 times.
1
2
3
4
5
#pragma omp parallel for
for (int32_t idx = 0; idx < triCount; idx++)
{
  //Triangle rasterization
}
That was quite an improvement but, 1h20 to render a Scene was not ideal, I had to dig further into detail to see where I was wasting time.
Triangle Bounding Box
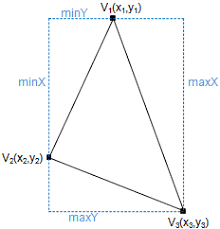
Looking at the code and thinking about its functionality it was easy to understand that looping over all the pixels in the screen space for ~260k triangles was not optimal; the higher the resolution got, the slower the program would finish its job.
For that reason, I implemented a bounding box around each triangle so that I could save time by only looping over the pixels contained in the bounding boxes.
To do so, I had to modify some parts of my code, first I implemented the bounding boxes coordinates:
1
2
3
4
5
6
7
8
9
10
11
12
13
14
15
16
17
18
19
20
21
22
23
24
25
//...

//Get the X coordinates of all vertices of a triangle contained in the screen space (Matrix)
float valueX1 = M[0].x / M[2].x;
float valueX2 = M[0].y / M[2].y;
float valueX3 = M[0].z / M[2].z;

//Get the Y coordinates of all vertices of a triangle contained in the screen space (Matrix)
float valueY1 = M[1].x / M[2].x;
float valueY2 = M[1].y / M[2].y;
float valueY3 = M[1].z / M[2].z;

//Create a "Bounding Box" to only loop over pixels in it when doing the EdgeEval
int minTriWidth = static_cast<int>(std::min({ valueX1, valueX2, valueX3 }));
int maxTriWidth = static_cast<int>(std::max({ valueX1, valueX2, valueX3 }));
int minTriHeight = static_cast<int>(std::min({ valueY1, valueY2, valueY3 }));
int maxTriHeight = static_cast<int>(std::max({ valueY1, valueY2, valueY3 }));

//Clamp values so that they dont go under or out of on the screen bounds
minTriWidth = std::clamp(minTriWidth, 0, static_cast<int>(m_ScreenWidth));
maxTriWidth = std::clamp(maxTriWidth, 0, static_cast<int>(m_ScreenWidth));
minTriHeight = std::clamp(minTriHeight, 0, static_cast<int>(m_ScreenHeight));
maxTriHeight = std::clamp(maxTriHeight, 0, static_cast<int>(m_ScreenHeight));

//...
Then I had to change the way my program looped so that it would no longer loop over the entire screen but only over the boxes.
I went from:
1
2
3
4
5
6
7
8
for (auto y = 0; y < m_ScreenHeight; y++)
{
  for (auto x = 0; x < m_ScreenWidth; x++)
  {
    //Edge Evaluation
    //if ok -> Triangle colorization
  }
}
To:
1
2
3
4
5
6
7
8
for (auto y = minTriHeight; y < maxTriHeight; y++)
{
  for (auto x = minTriWidth; x < maxTriWidth; x++)
  {
    //Edge Evaluation
    //if ok -> Triangle colorization
  }
}
With that optimization and no multithreading (omp commented out) the execution time was brought down to only 1 minute! That meant that, with a single thread, the bounding boxes optimized my code by roughly 3920 times!
Combined, the program only took 26 seconds. That was already a massive improvement compared to the original version.
At that point I probably could have stopped optimizing, lowered the resolution and go with that version of it but I wasn’t totally satisfied. I wanted my rasterizer to run in real time (max 40 ms). So, I continued to search ways to improve my program and started to use Google’s benchmarks to measure the real time my program took without accounting the loading of objects and the writing of the png.
Benchmarks
I started by implementing a benchmark function that took my TransformScene() method and iterated multiple time on it to get an average value of the time spent with different objects/scenes and resolutions.
After reading the documentation, the set up was quite simple, first I declared the different variables that were to be used:
1
2
3
4
constexpr uint32_t widths[] = { 1024u, 1920u, 3840u, 7680u };
constexpr uint32_t heights[] = { 768u, 1080u, 2160u, 4320u };
constexpr int fromRange = 0;
constexpr int toRange = 3;
As you can see above, I used four different resolutions to give to my function and the indexes of min range fromRange and max range toRange that referred to the resolutions.
Then I set up the Benchmark function to be used :
1
2
3
4
5
6
7
8
9
10
11
12
13
14
15
16
17
18
19
20
21
22
23
static void BM_Transform(benchmark::State& state, std::string_view objectName)
{
  Camera camera;

  if (objectName != "sponza")
  {
    camera.SetNearPlane(0.1f);
    camera.SetFarPlane(100.f);
    camera.SetEyePosition(glm::vec3(0, 5, 10));
    camera.SetLookDirection(glm::vec3(0, 0, 0));
    camera.SetViewAngle(45.0f);
    camera.SetupCamera();
  }
  camera.SetupCamera();
  Scene scene(camera);
  scene.LoadObject(fmt::format("../assets/{0}.obj", objectName));

  for (auto _ : state)
  {
    Rasterizer rasterizer(std::move(scene), widths[state.range(0)], heights[state.range(0)]);
    rasterizer.TransformScene();
  }
}
I added an argument to it objectName so that I could change the name of the object to transform. As you might see, I had to add an extra check on the name since the original project used the sponza scene and thus special camera parameters.
The for(auto _ : state) would then loop and iterate using the different ranges of resolutions. The benchmarks had the following conditions:
1
2
3
4
5
6
7
8
9
10
11
12
13
BENCHMARK_CAPTURE(BM_Transform, TransformCube, "cube")
->DenseRange(fromRange, toRange, 1)
->Unit(benchmark::kMillisecond)
->MinTime(10.0);
BENCHMARK_CAPTURE(BM_Transform, TransformBackpack, "backpack")
->DenseRange(fromRange, toRange, 1)
->Unit(benchmark::kMillisecond)
->MinTime(10.0);
BENCHMARK_CAPTURE(BM_Transform, TransformScene, "sponza")
->DenseRange(fromRange, toRange, 1)
->Unit(benchmark::kMillisecond)
->MinTime(10.0);
BENCHMARK_MAIN();
Here, the BENCHMARK_CAPTURE(BaseFunction, FunctionName, Args...) enabled me to pass my custom parameter.
The DenseRange(begin, end, step) forces the benchmark to do the tests by incrementation of the step value including the begin, the end.
The Unit(benchmark::kMillisecond) just prints the time in milliseconds instead of nanoseconds, measuring in milliseconds was just more relevant for my project.
And finally the MinTime(time_in_seconds) was to insure that there would be enough iterations at a high resolution.
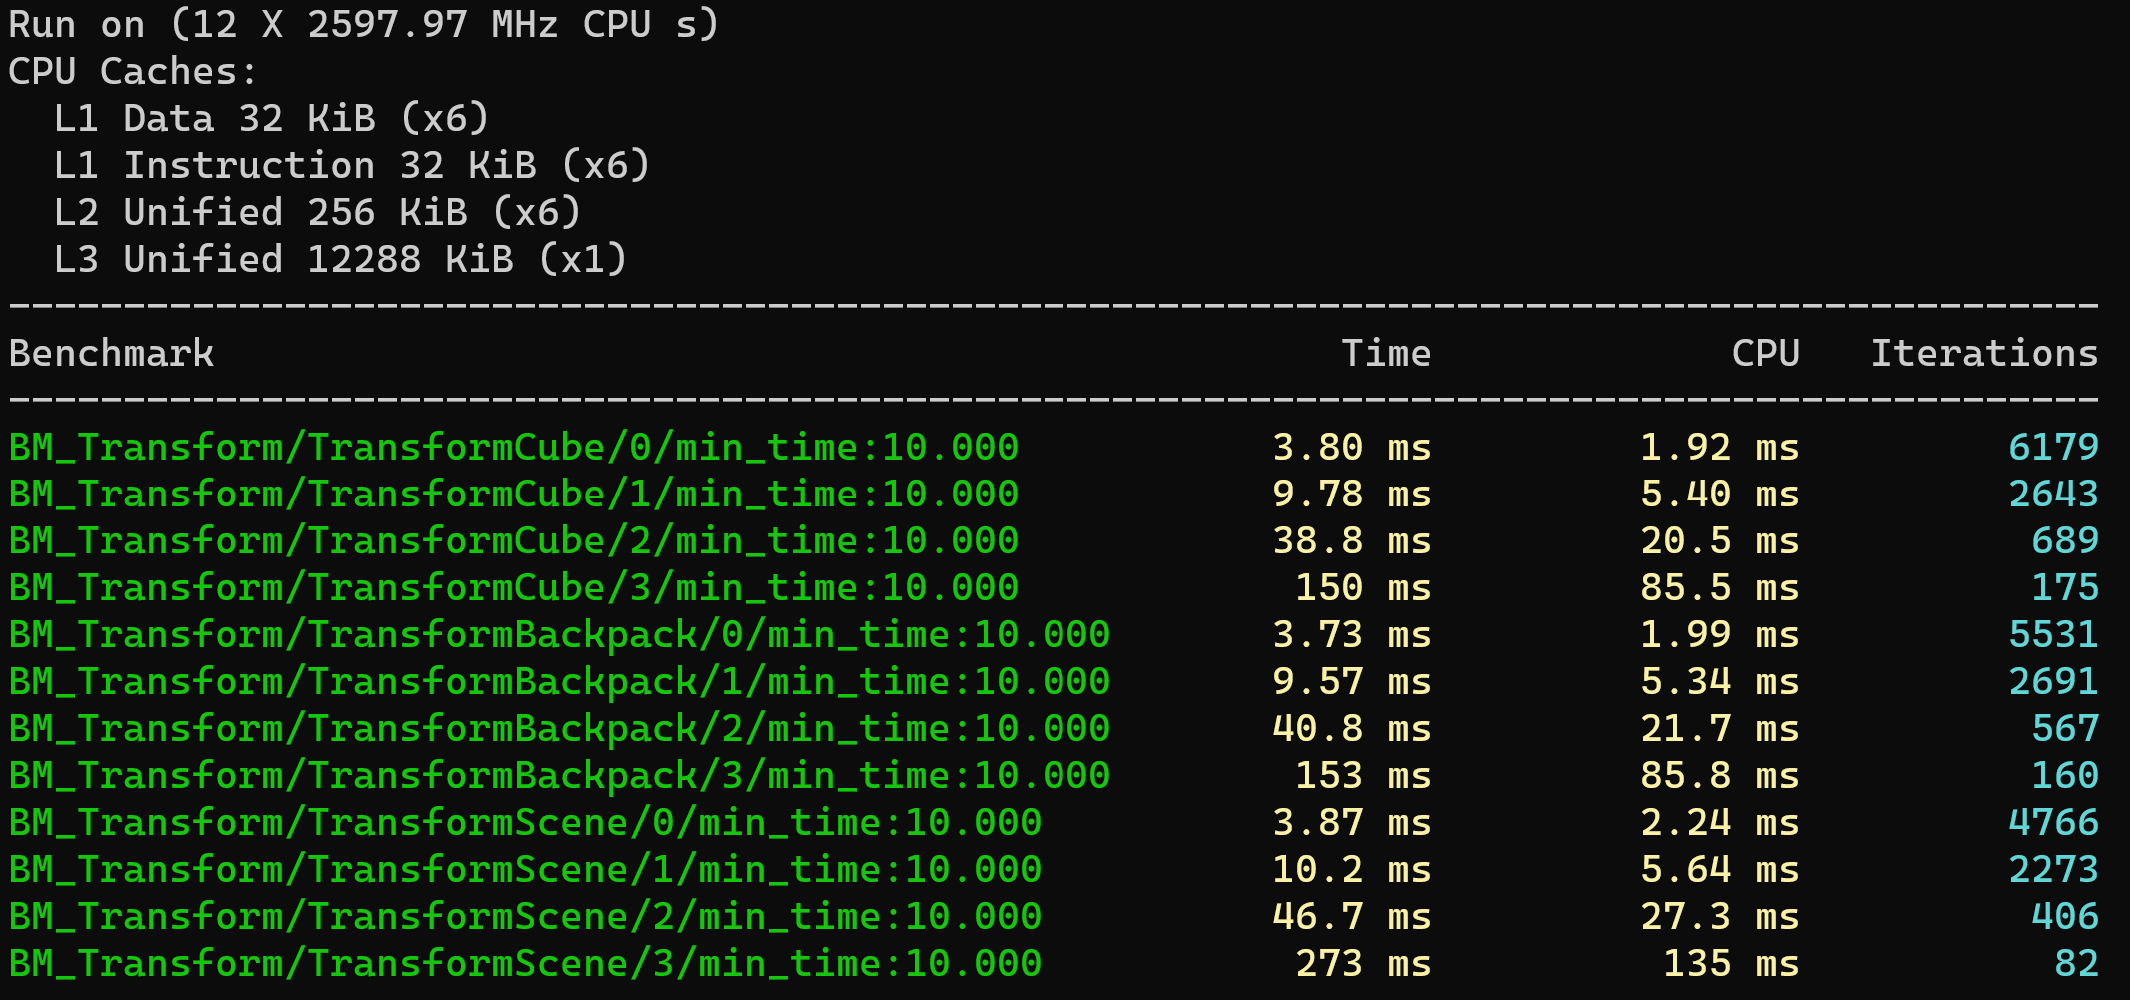
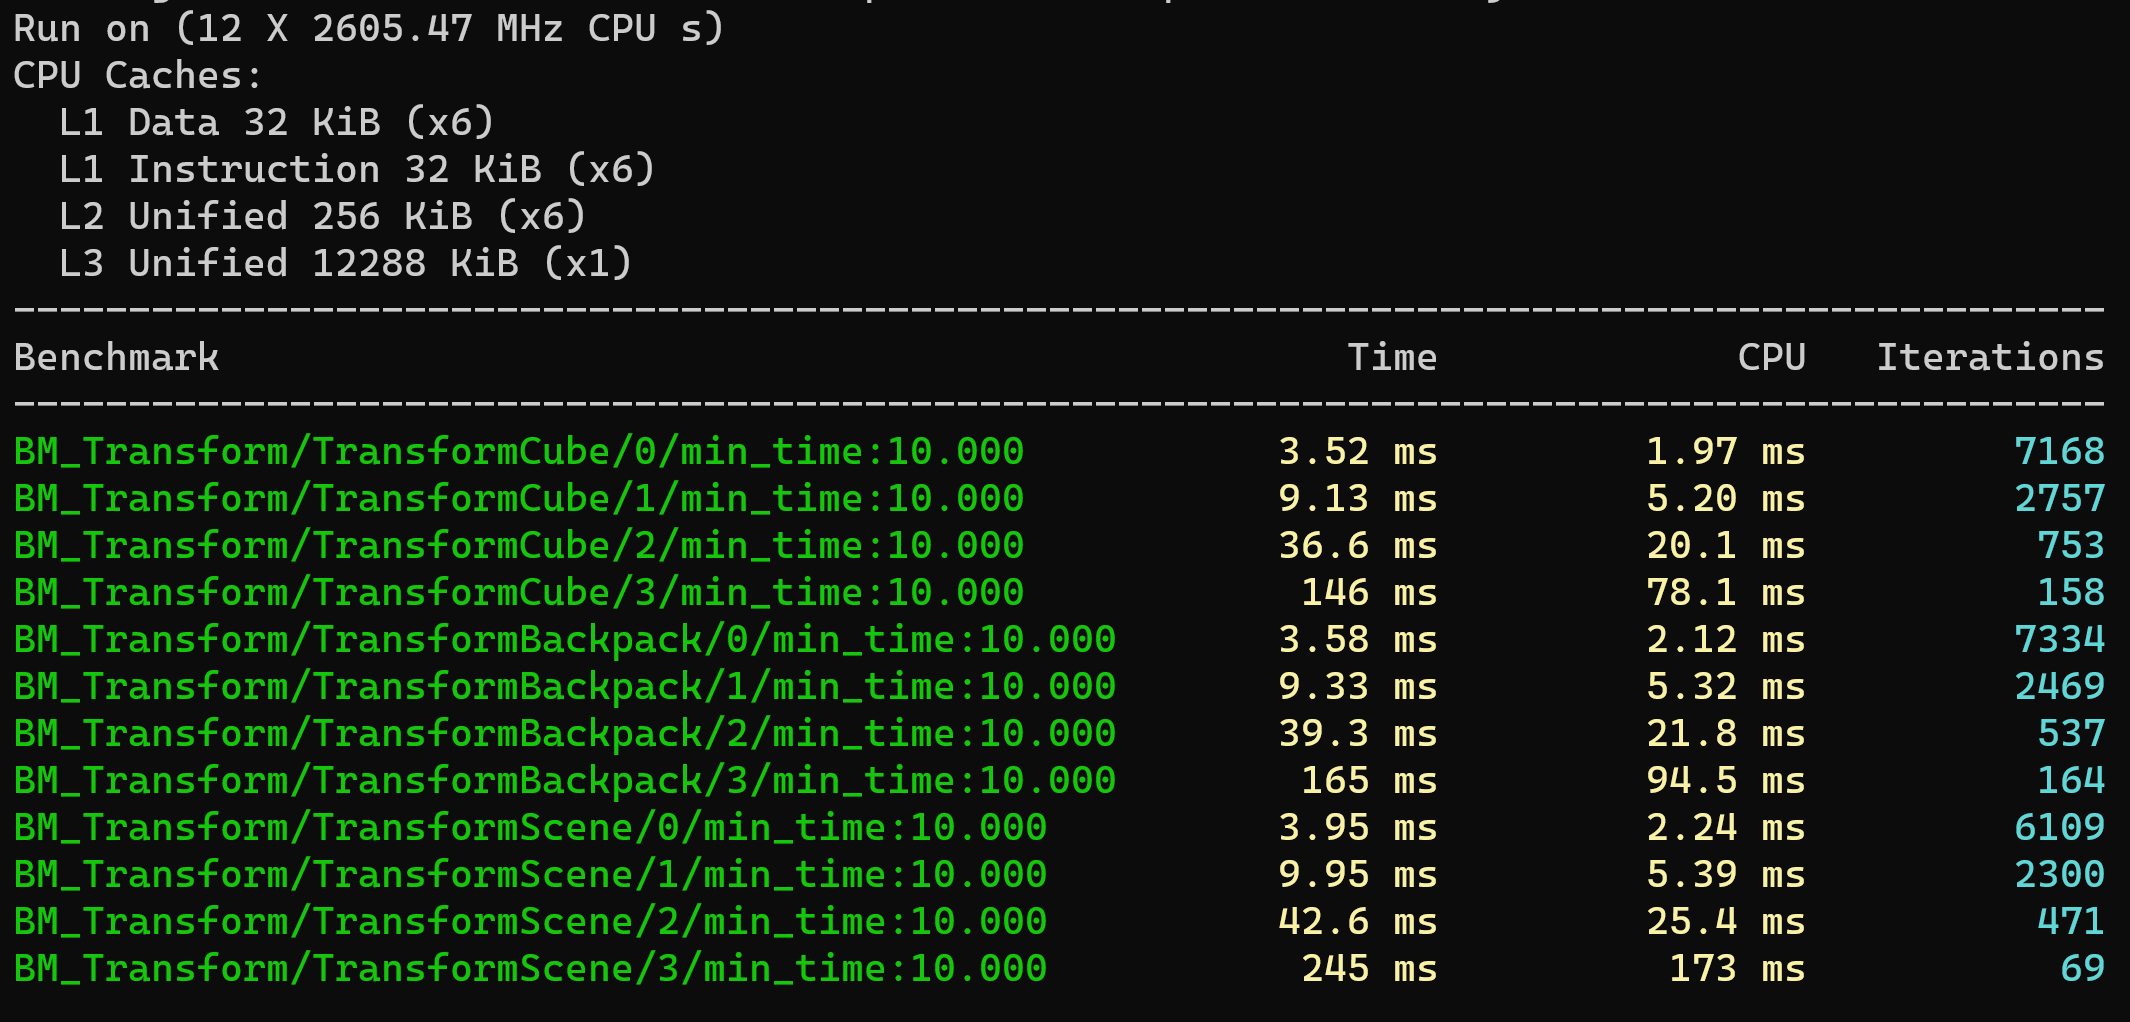
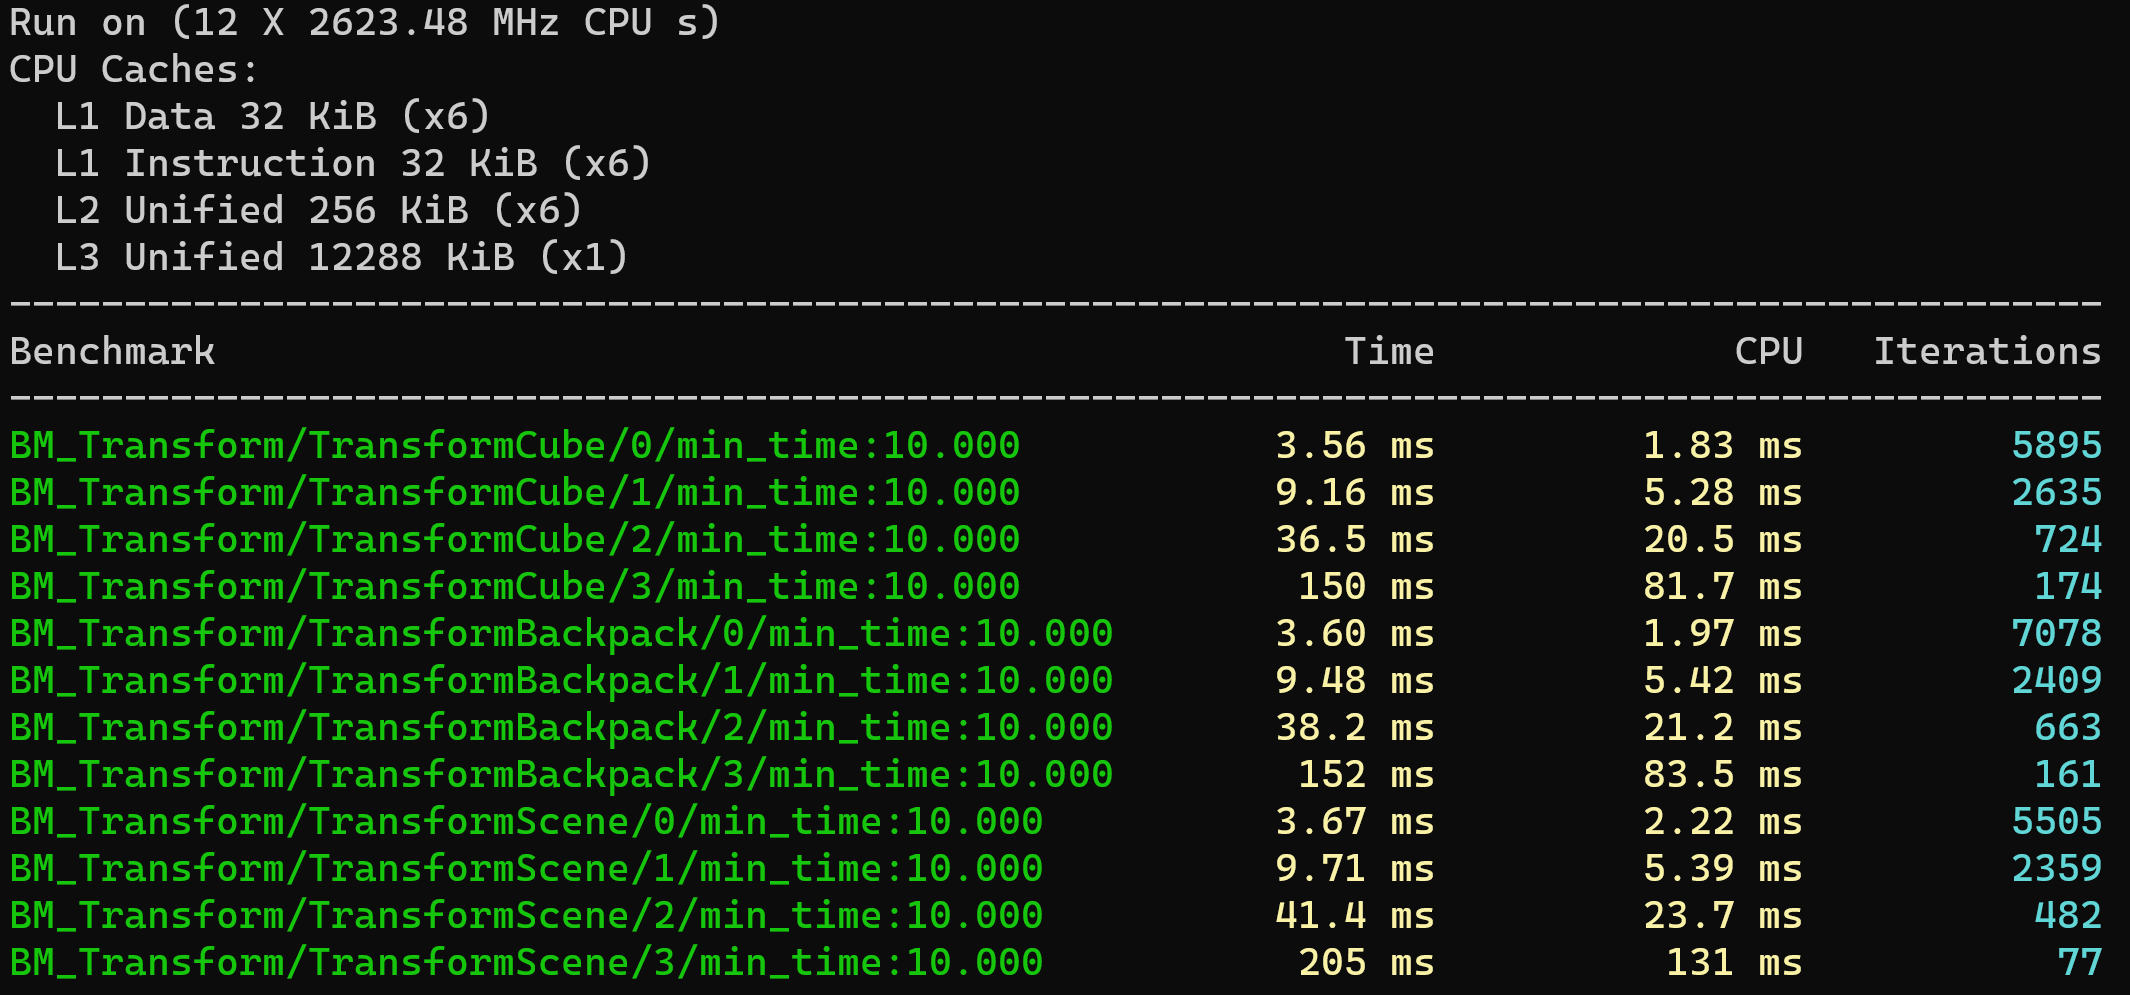
The first benchmark results where the following:
The result was looking quite good but I still had bottlenecks that had to be dealt with.
OMP specific parameters
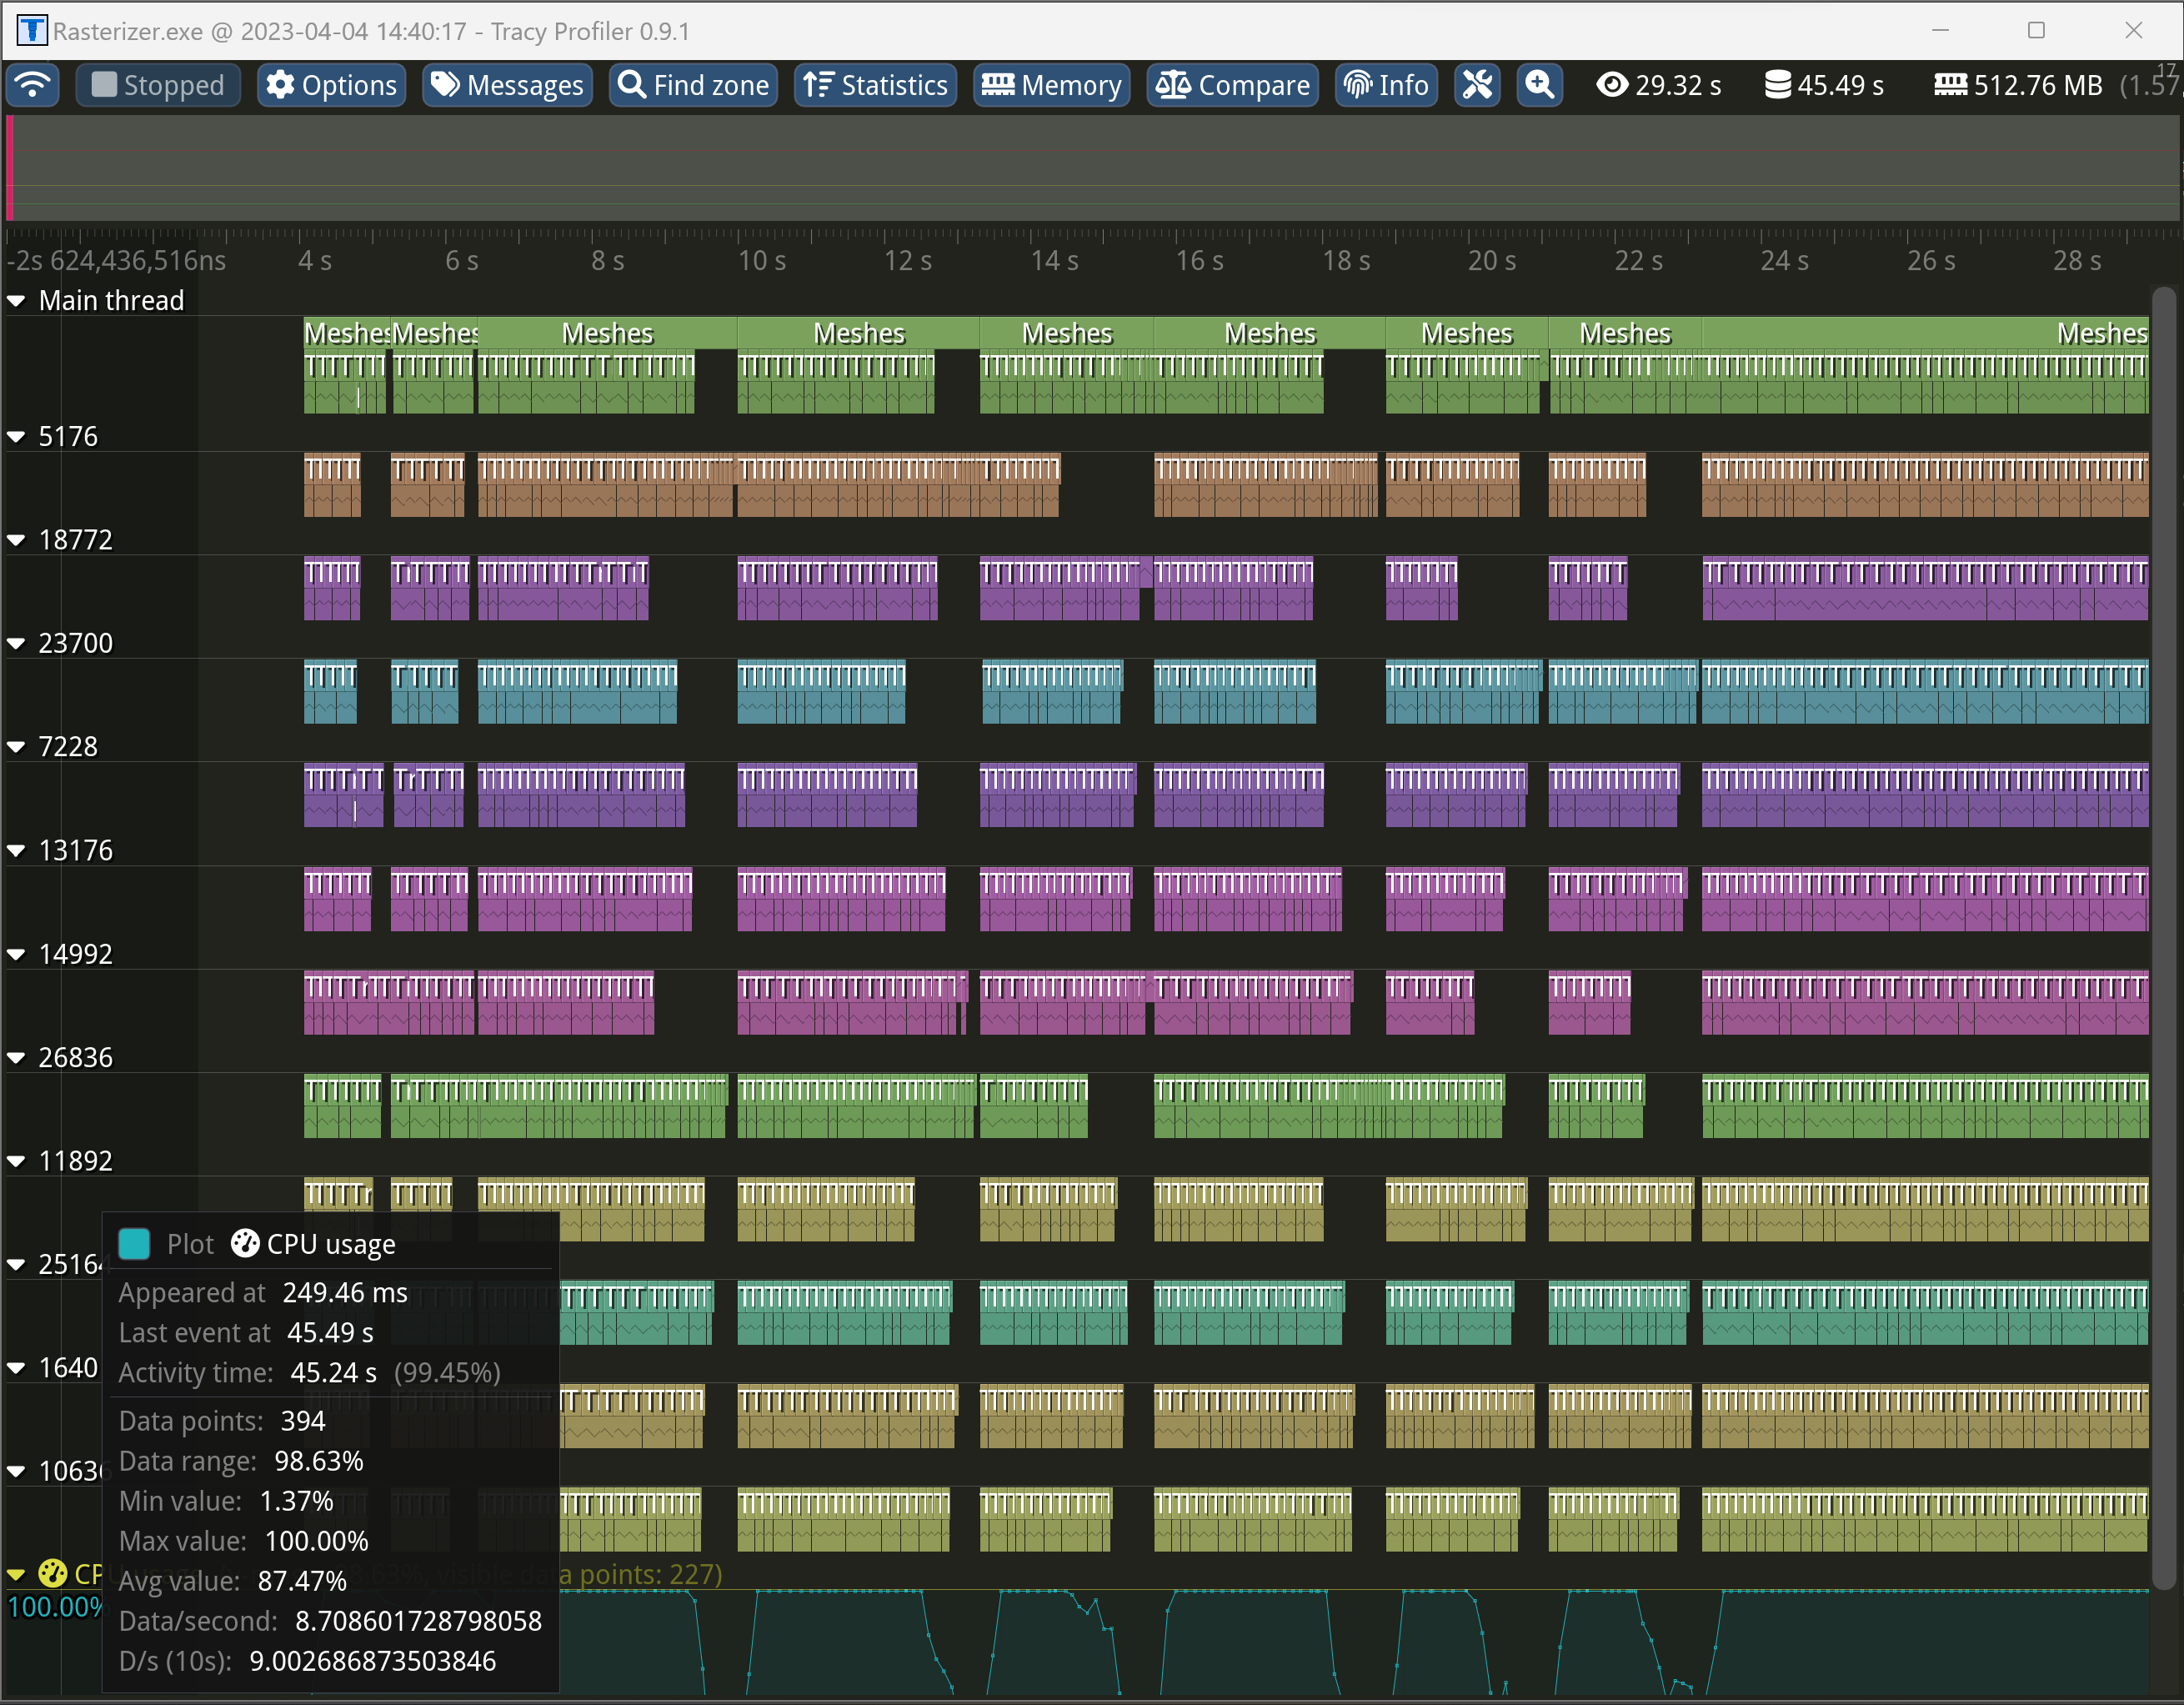
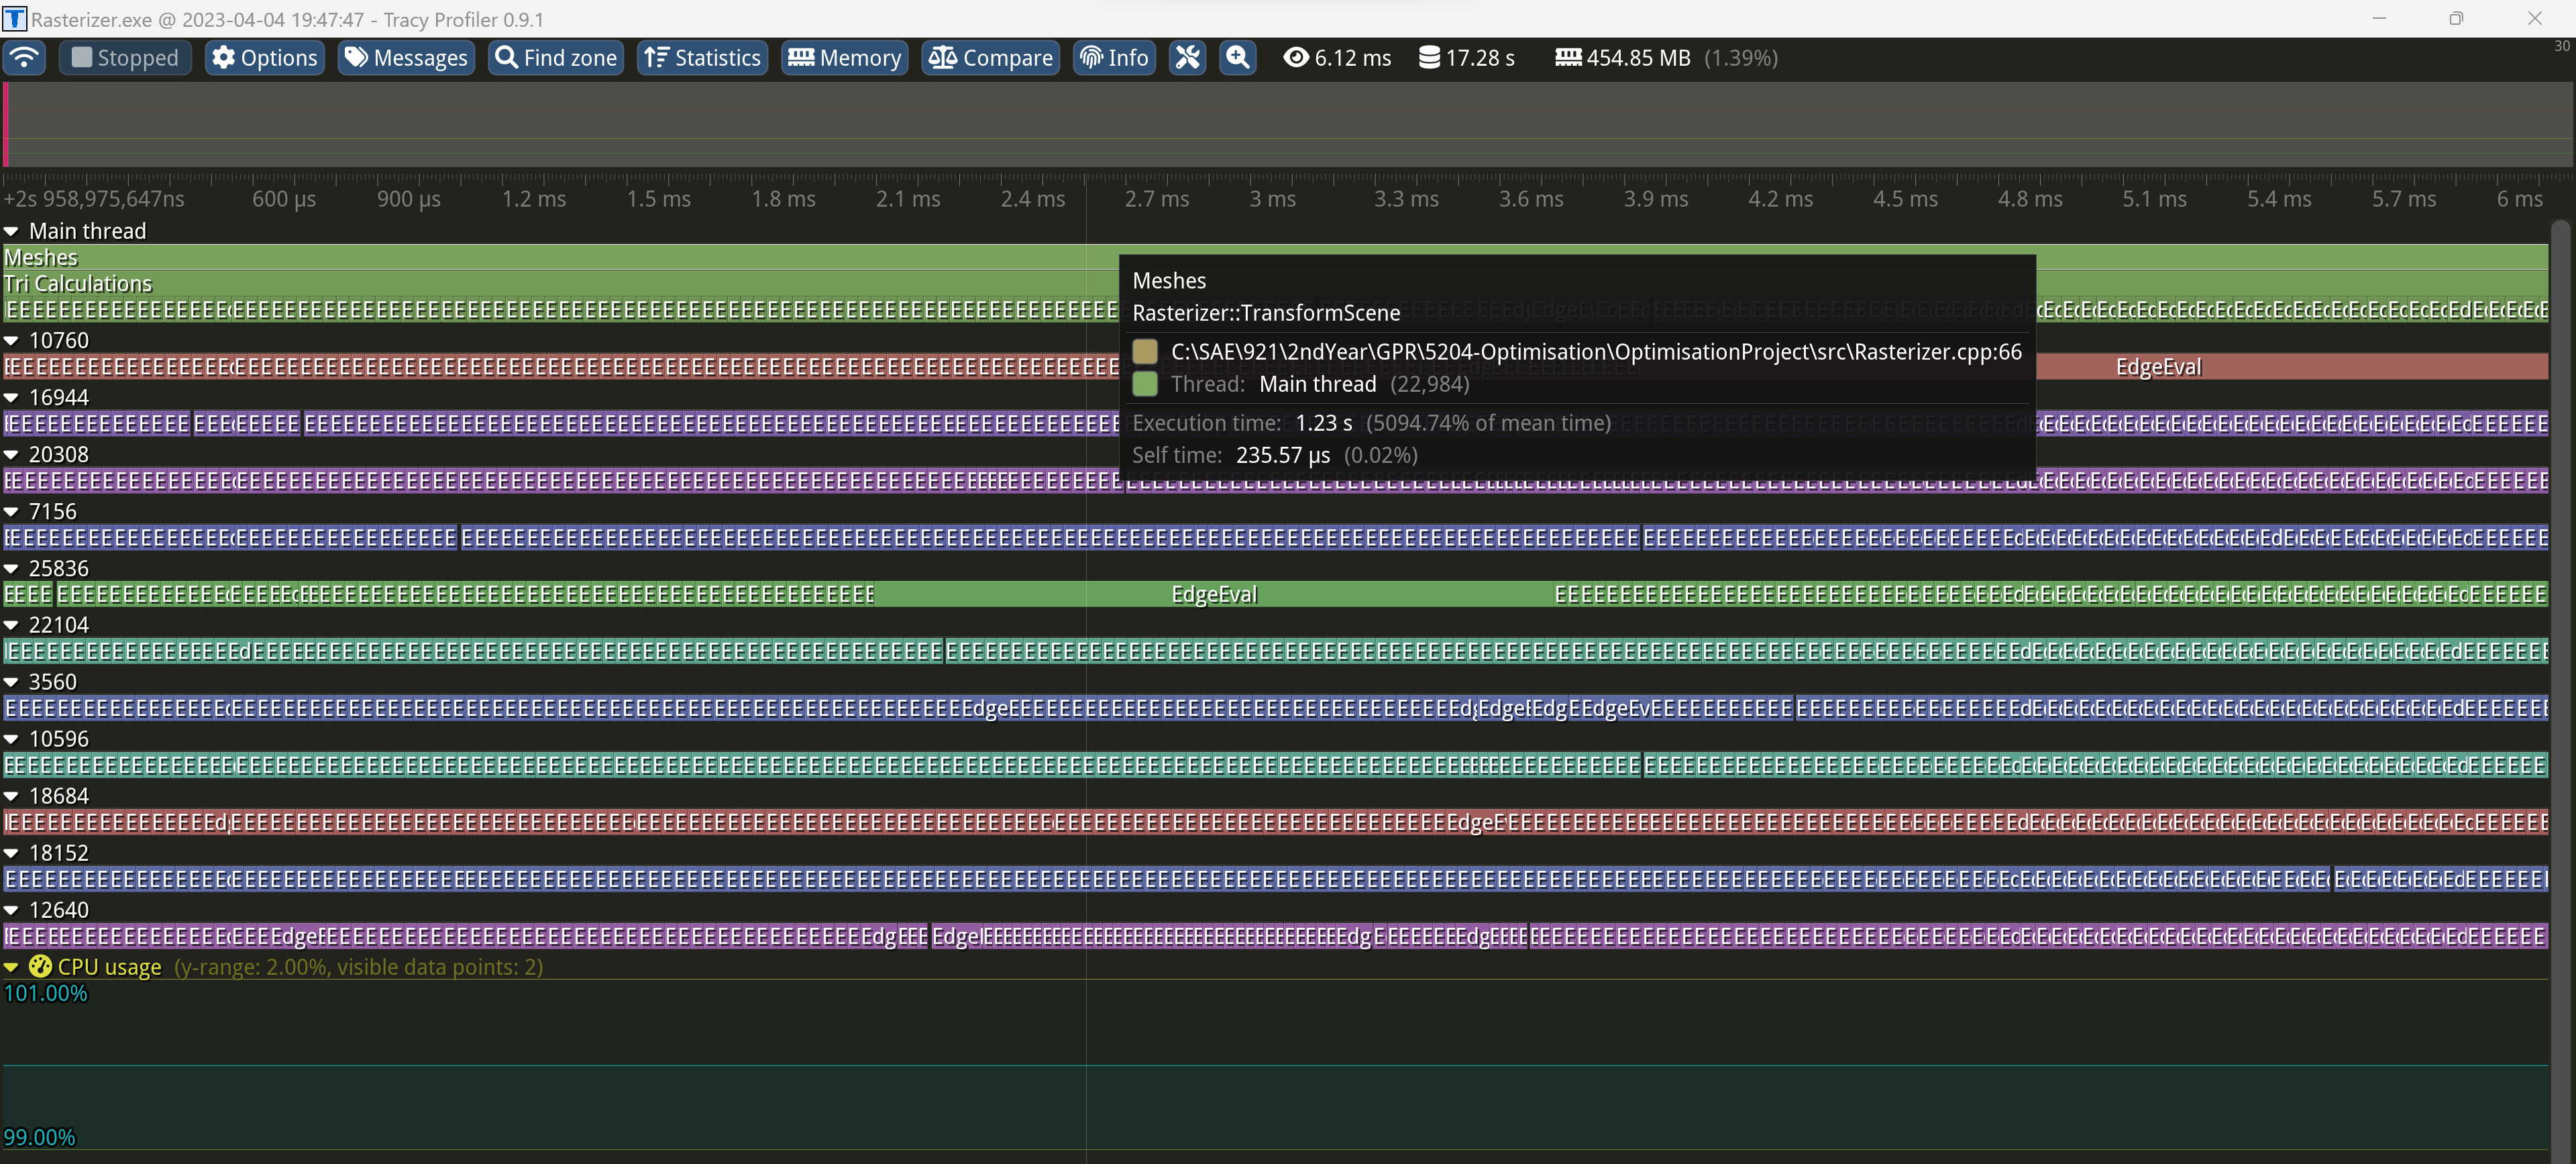
One of the bottlenecks I noticed by profiling with Tracy was that the Triangle calculations where always stopped per mesh. That meant that some threads stopped working and would wait for the next mesh to be processed before starting a new work.
For that reason, I started to look into the OMP parameters and after multiple profiling sessions, I found that if I multithreaded the pixels looping (per triangle) instead of the entire triangle transformation it went a little bit faster and the threads wouldn’t wait for work.
To obtain that result the modifications where the following:
1
2
3
4
5
6
7
8
9
#pragma omp parallel for collapse(2) schedule(dynamic)
for (auto y = minTriHeight; y < maxTriHeight; y++)
{
  for (auto x = minTriWidth; x < maxTriWidth; x++)
  {
    //Edge Evaluation
    //if ok -> Triangle colorization
  }
}
As you can see, compared to the older version I added collapse(2) that indicates that there is a nested for loop and enables work-sharing between them and schedule(dynamic) that separates the iterations into chunks of work where the amount of chunks are dynamically defined.
With that little modification, my program went from 26 seconds to 20 and the benchmark results where the following:
Incremental Edge Function
After the previous steps, I was blocked and didn’t know what I could do to optimize my program even more. So, I went back to Tracy and looked where my program spent the most time and found that some of my meshes where really slow to be processed (slowest 1.23 seconds)
So, I had to find a way to optimize calculations. That is when I found this course from MIT on Graphics Pipeline & Rasterizer. On page 58-60 they talk about “Incremental Edge Functions” it seemed like a good idea, so I implemented it:
1
2
3
4
5
6
7
8
9
10
11
12
13
14
15
16
17
18
19
20
21
22
23
24

#pragma omp parallel for collapse(2) schedule(dynamic)
for (auto y = minTriHeight; y < maxTriHeight; y++)
{
  //Evaluate Edge for the x0,y (instead of scanline we use Incremental edge func.)
  glm::vec2 sample = { minTriWidth + 0.5f , y + 0.5f };
  float Ei1 = EvaluateEdgeFunction(E0, sample);
  float Ei2 = EvaluateEdgeFunction(E1, sample);
  float Ei3 = EvaluateEdgeFunction(E2, sample);

  for (auto x = minTriWidth; x < maxTriWidth; x++)
  {
    // If sample is "inside" of all three half-spaces bounded by the three edges of the triangle, it's 'on' the triangle
    if (Ei1 > 0.0f && Ei2 > 0.0f && Ei3 > 0.0f)
    {
      //Triangle colorization
    }
    //Increment Egde position for all x on the y scanline (Incremental edge func.)
    Ei1 += E0.x;
    Ei2 += E1.x;
    Ei3 += E2.x;
  }
}
For this adaptation I had to change the EvaluateEdgeFunction() that originally returned a bool that was true if the E(n)’s value was higher than 0 and just return the value of the calculation directly. Then the basic concept is that instead of calculating the Edge for each pixel (Xn,Yn) we calculate it just once per Y line (X0,Yn) and after each X loop we move the edges of our function so that we get a result for all the X pixels without calculating the edge again.
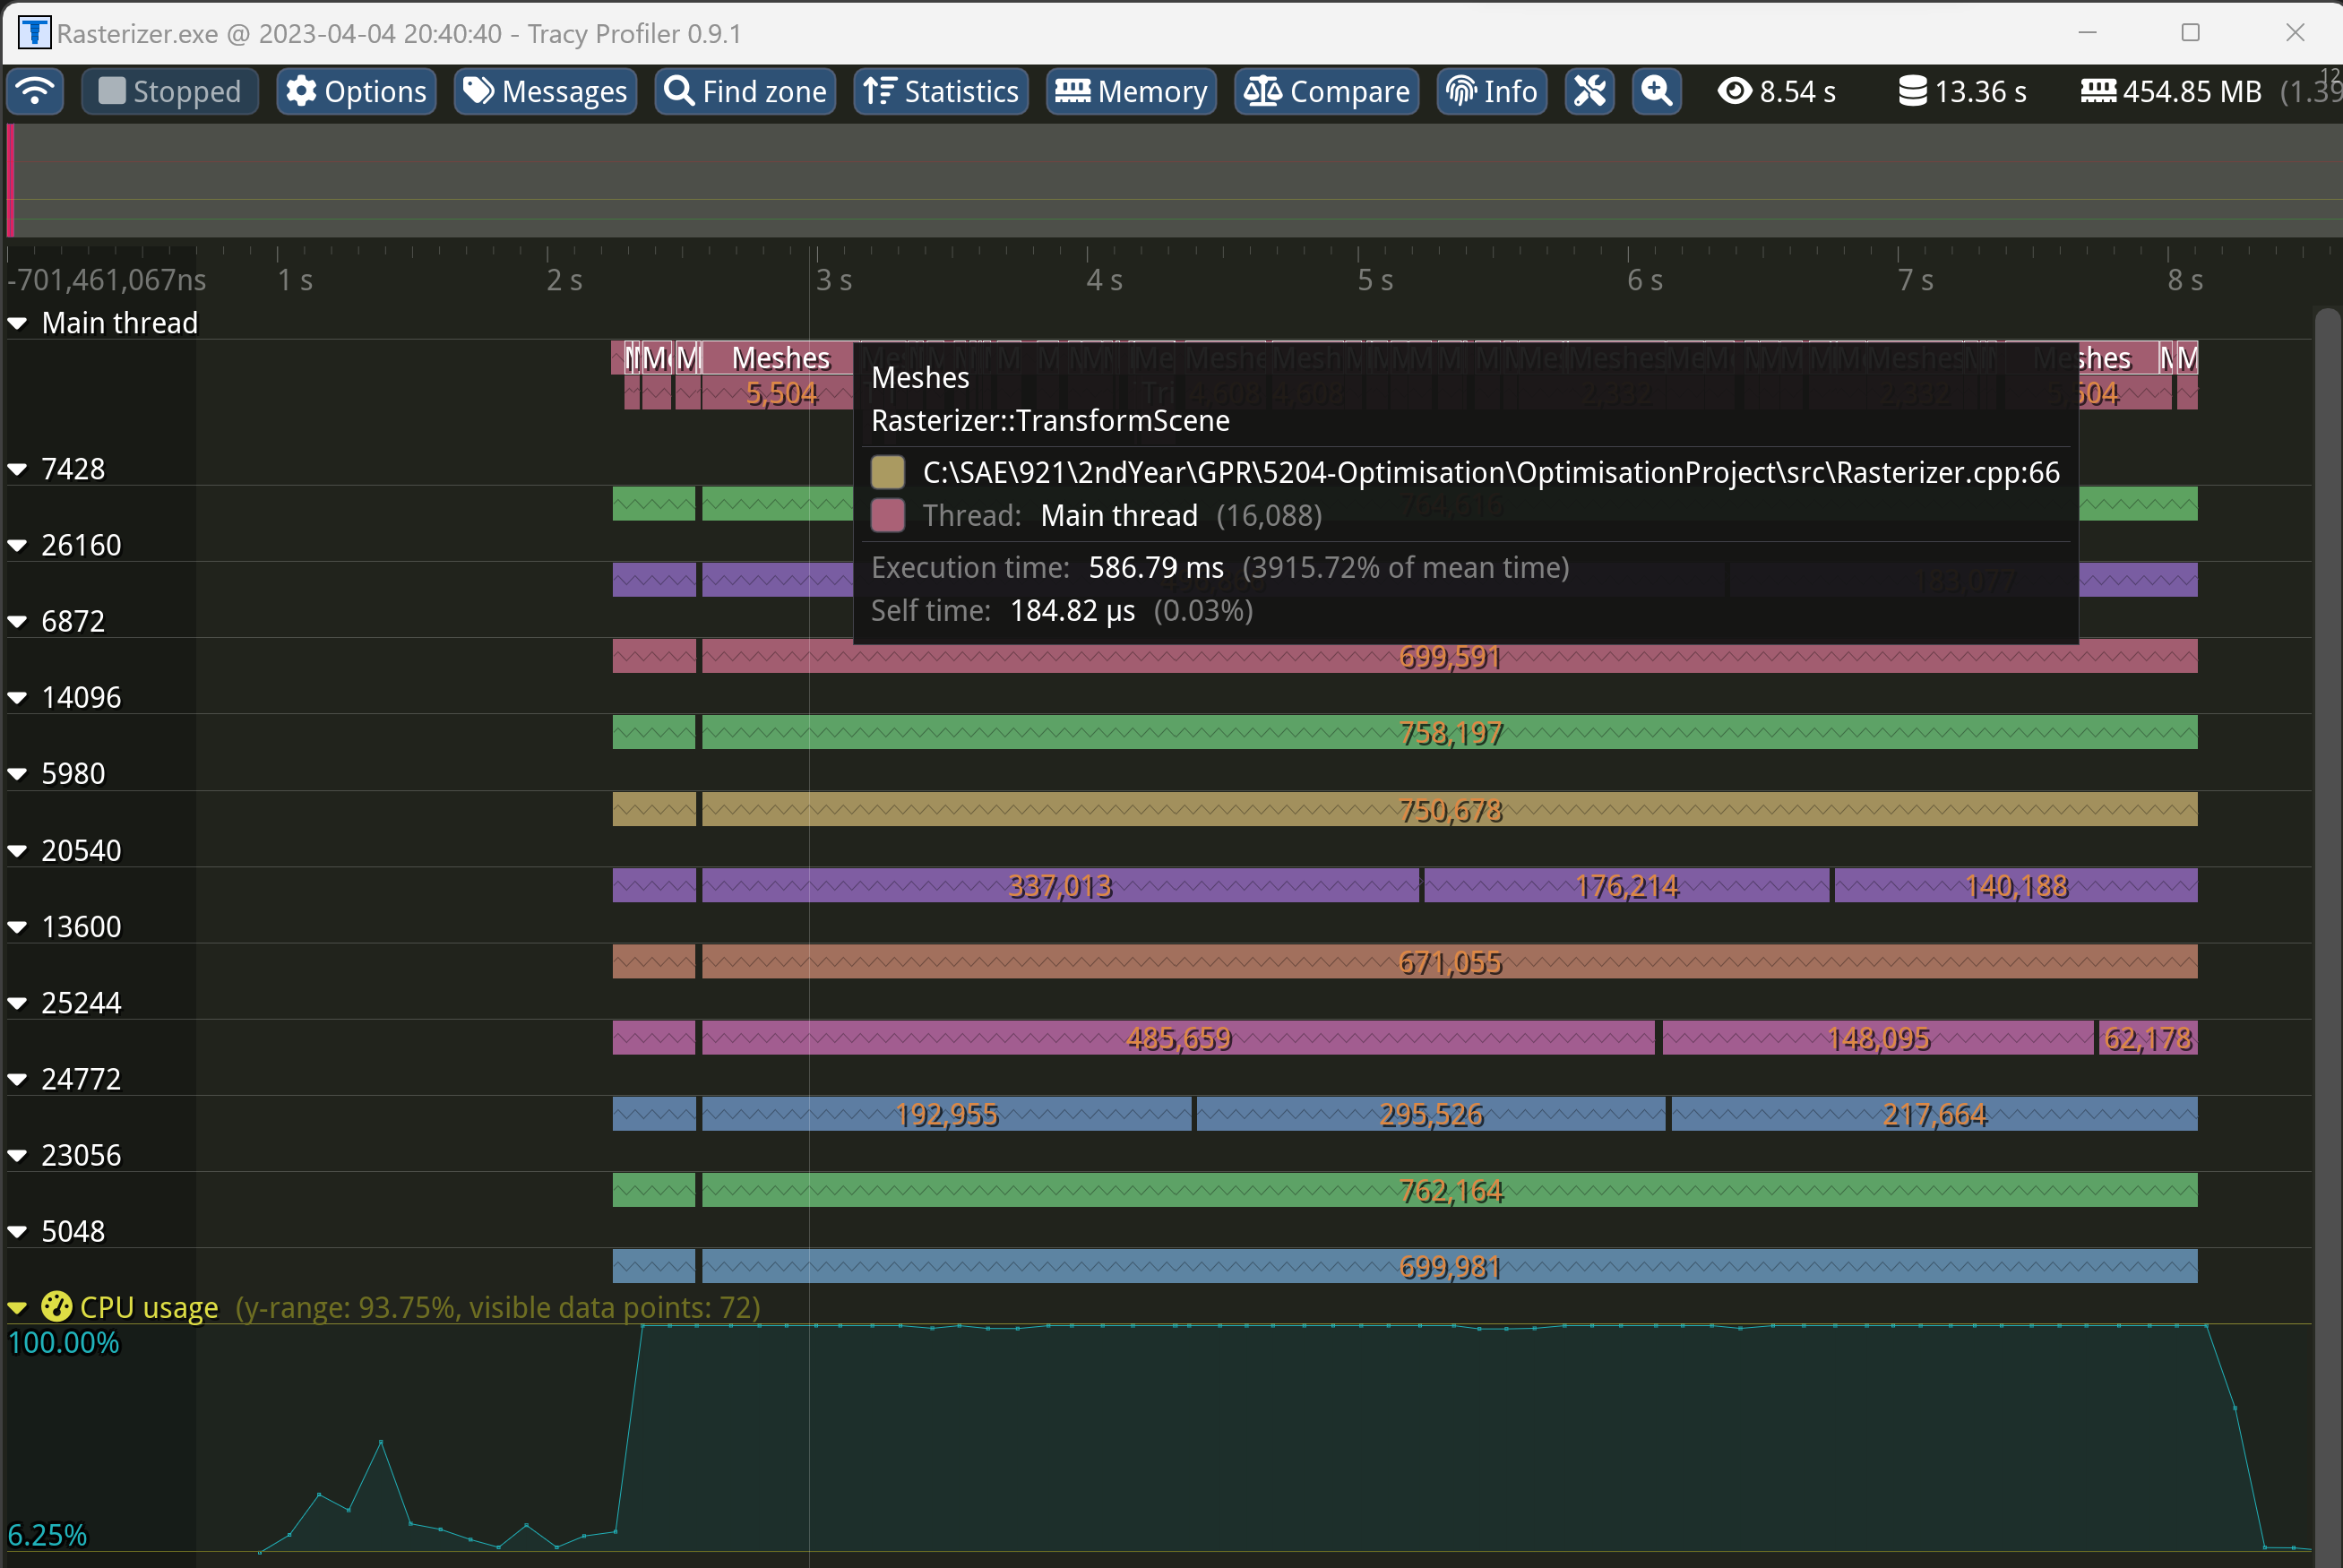
As you can see, the biggest mesh in my scene went from 1.23 seconds to 586.79 milliseconds. My program’s execution time, with this optimization, went from 20 seconds to 14 and the benchmark’s results were the following:
Taking in account that the loading of the objects takes ~2 seconds and that the .png writing takes ~6 seconds. The core of my program takes roughly 6 seconds to rasterize my scene. We also have to take in account that the program is running with Tracy and console logs such as std::cout and std::chrono that, at this point, do take up some time. The last element to remember is that the resolution (7680x4320) isn’t realistic for the general user’s screen.
All these statements took me to the last point.
Flags and useless code
The last point of optimization I could think of was to delete useless code and disable Tracy (as mentioned higher up) and activate all the compilation flags available to optimize my program.
After some research on compile flags on MSVC and Clang, I decided to add to my CMakeList.txt the following compiler options:
1
2
3
4
5
6
7
if (MSVC)
  # MinimumSize/MaximumSpeed flag
  add_compile_options(/O2 /fp:fast)
else()
  # Optimize speed + add openMP
  add_compile_options(-O3 -ffast-math -fopenmp=libomp)
endif()
Due to a lack of time, I wasn’t able to go in depth though the subject of compiler options (flags) so I at least tried to add some that seemed useful.
On MSVC:
/O2 Maximize Speed.
/fp:fast that optimizes floating-point code for speed and space.
For other compilers:
-O3 that is the highest level of optimization for the compilers.
-ffast-math that allows aggressive, lossy floating-point optimizations.
-fopenmp=libomp that enables OpenMP features.
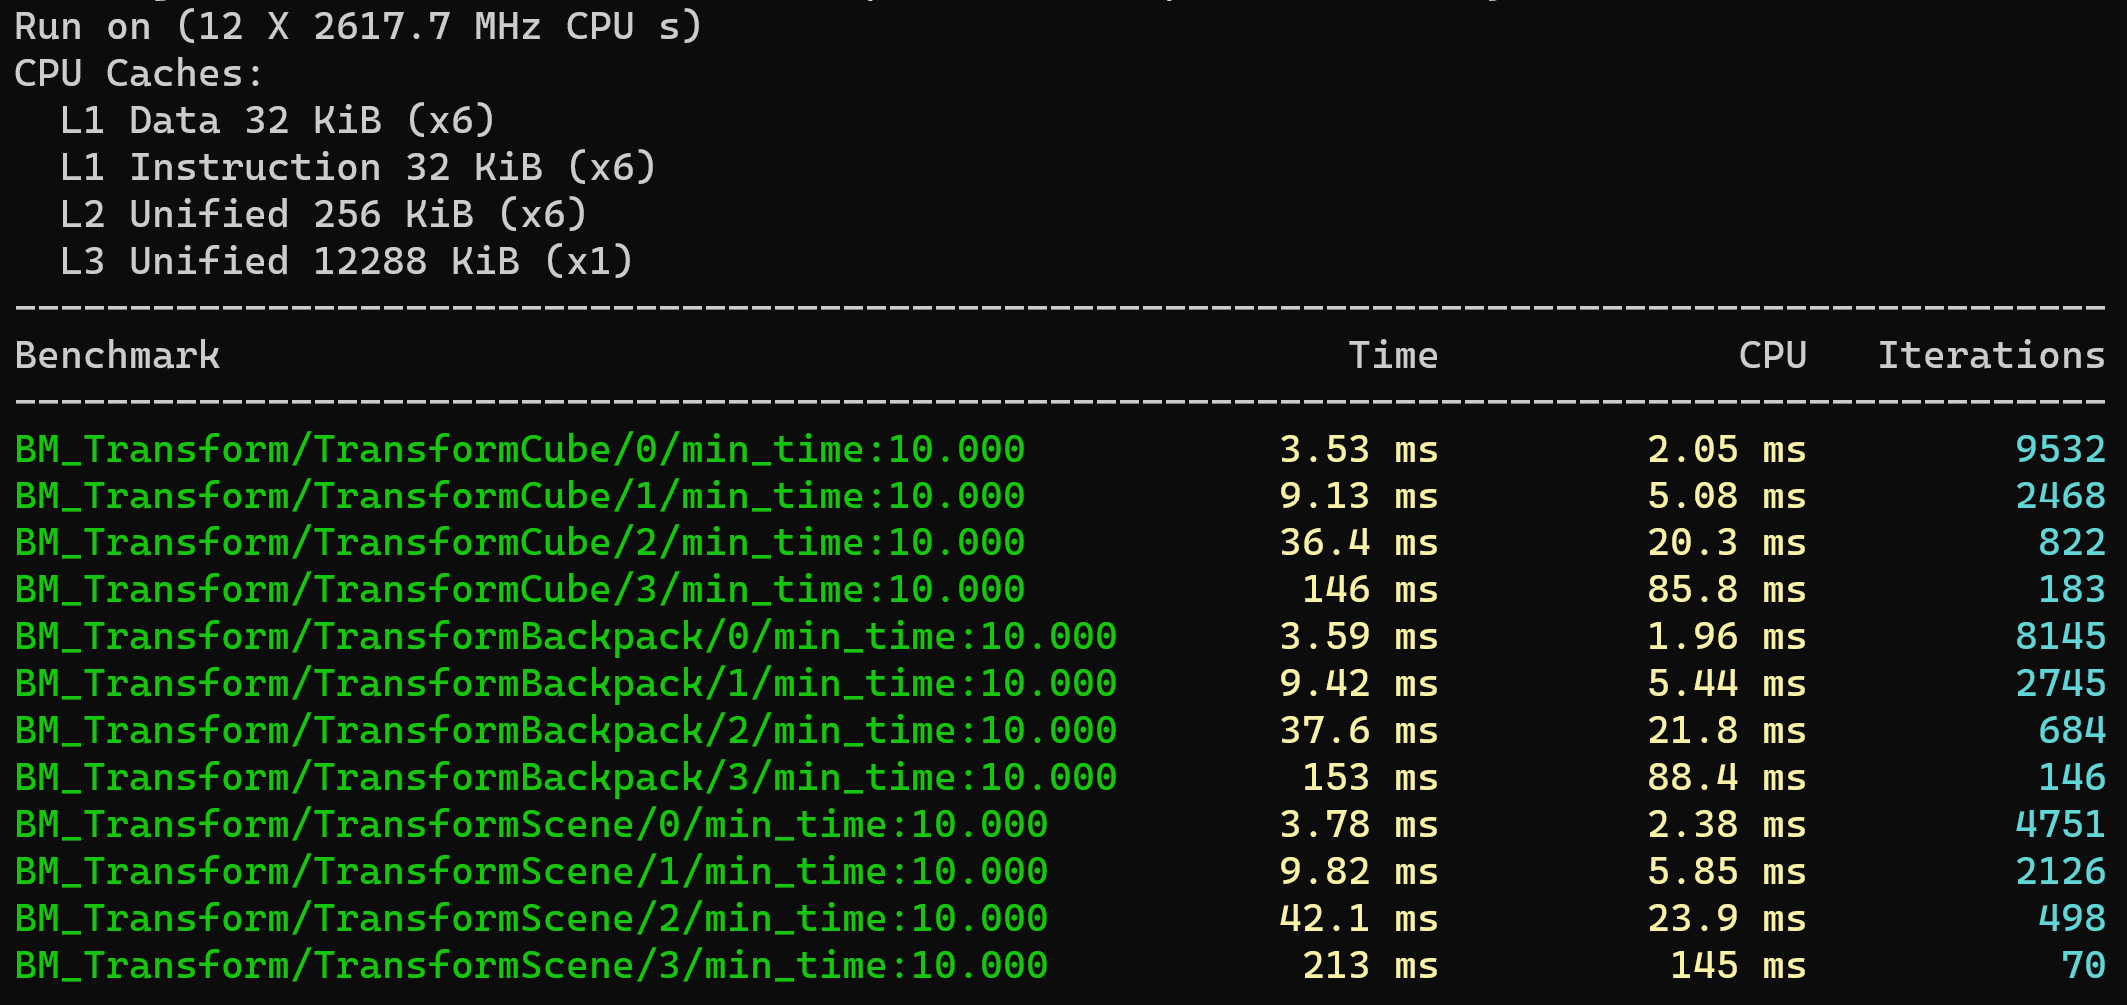
After running a final benchmark I ended up with these values:
Optimization Graph
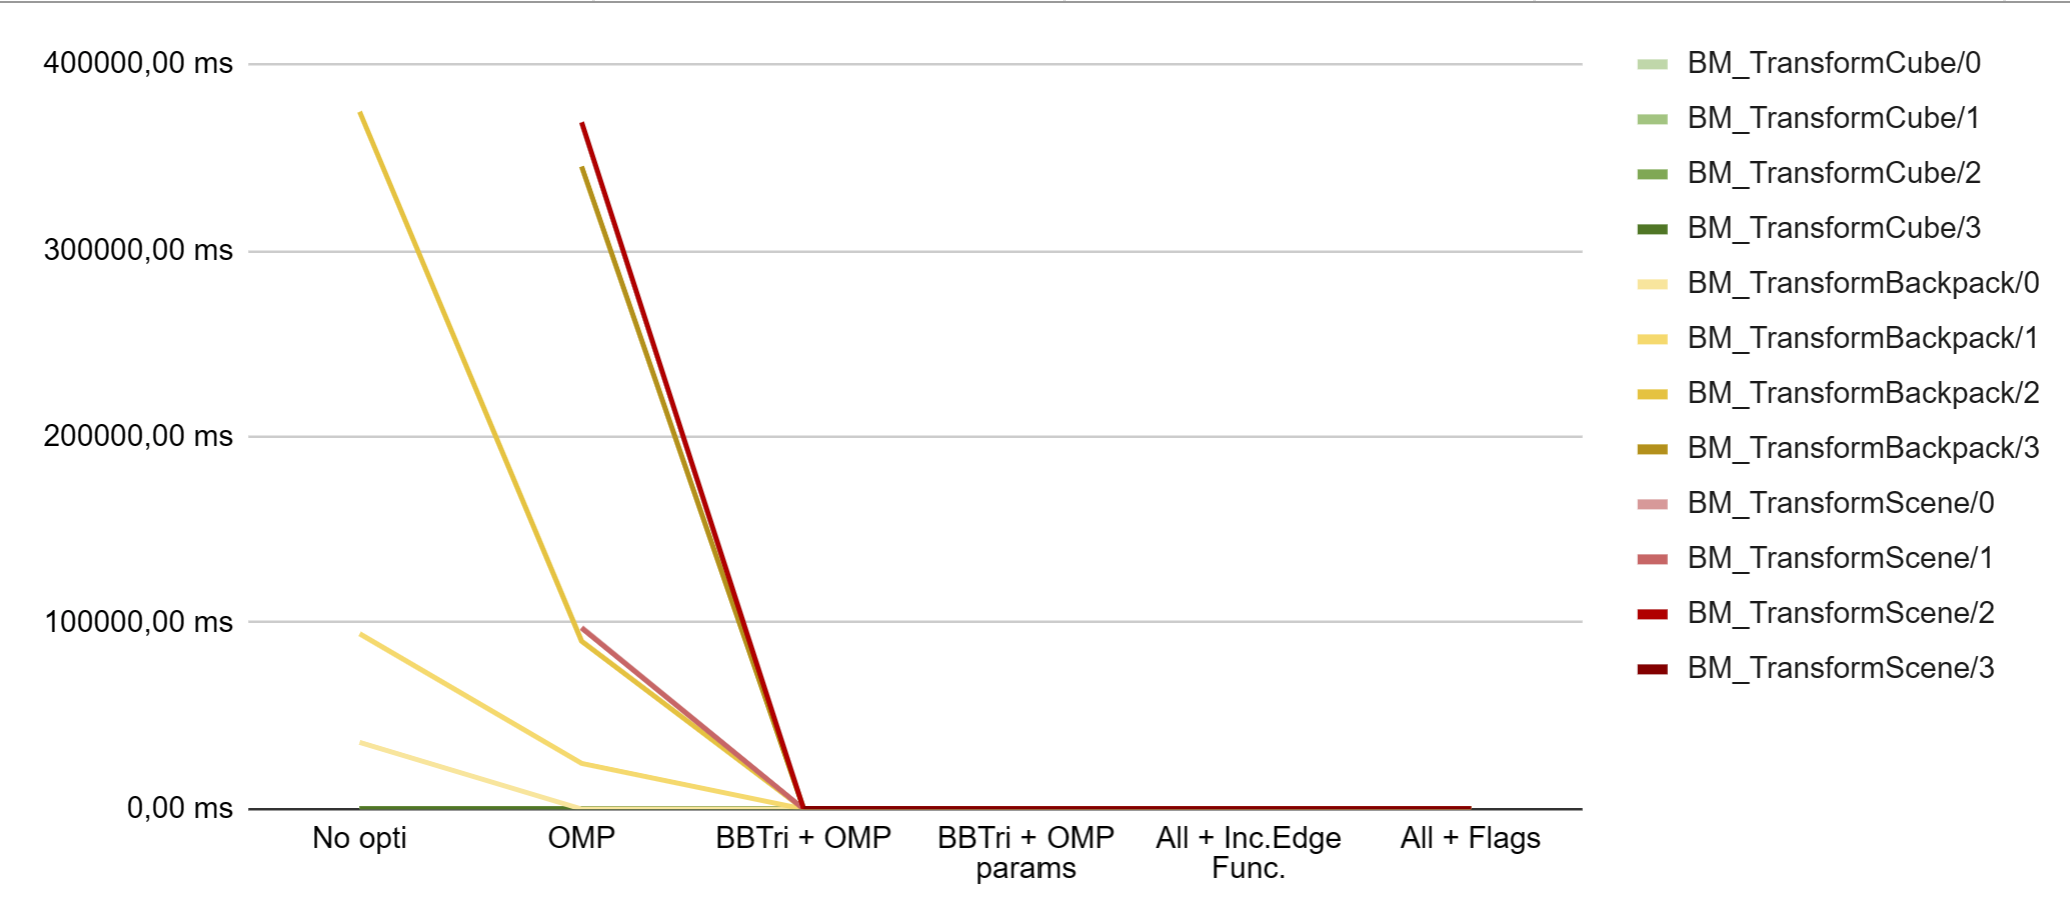
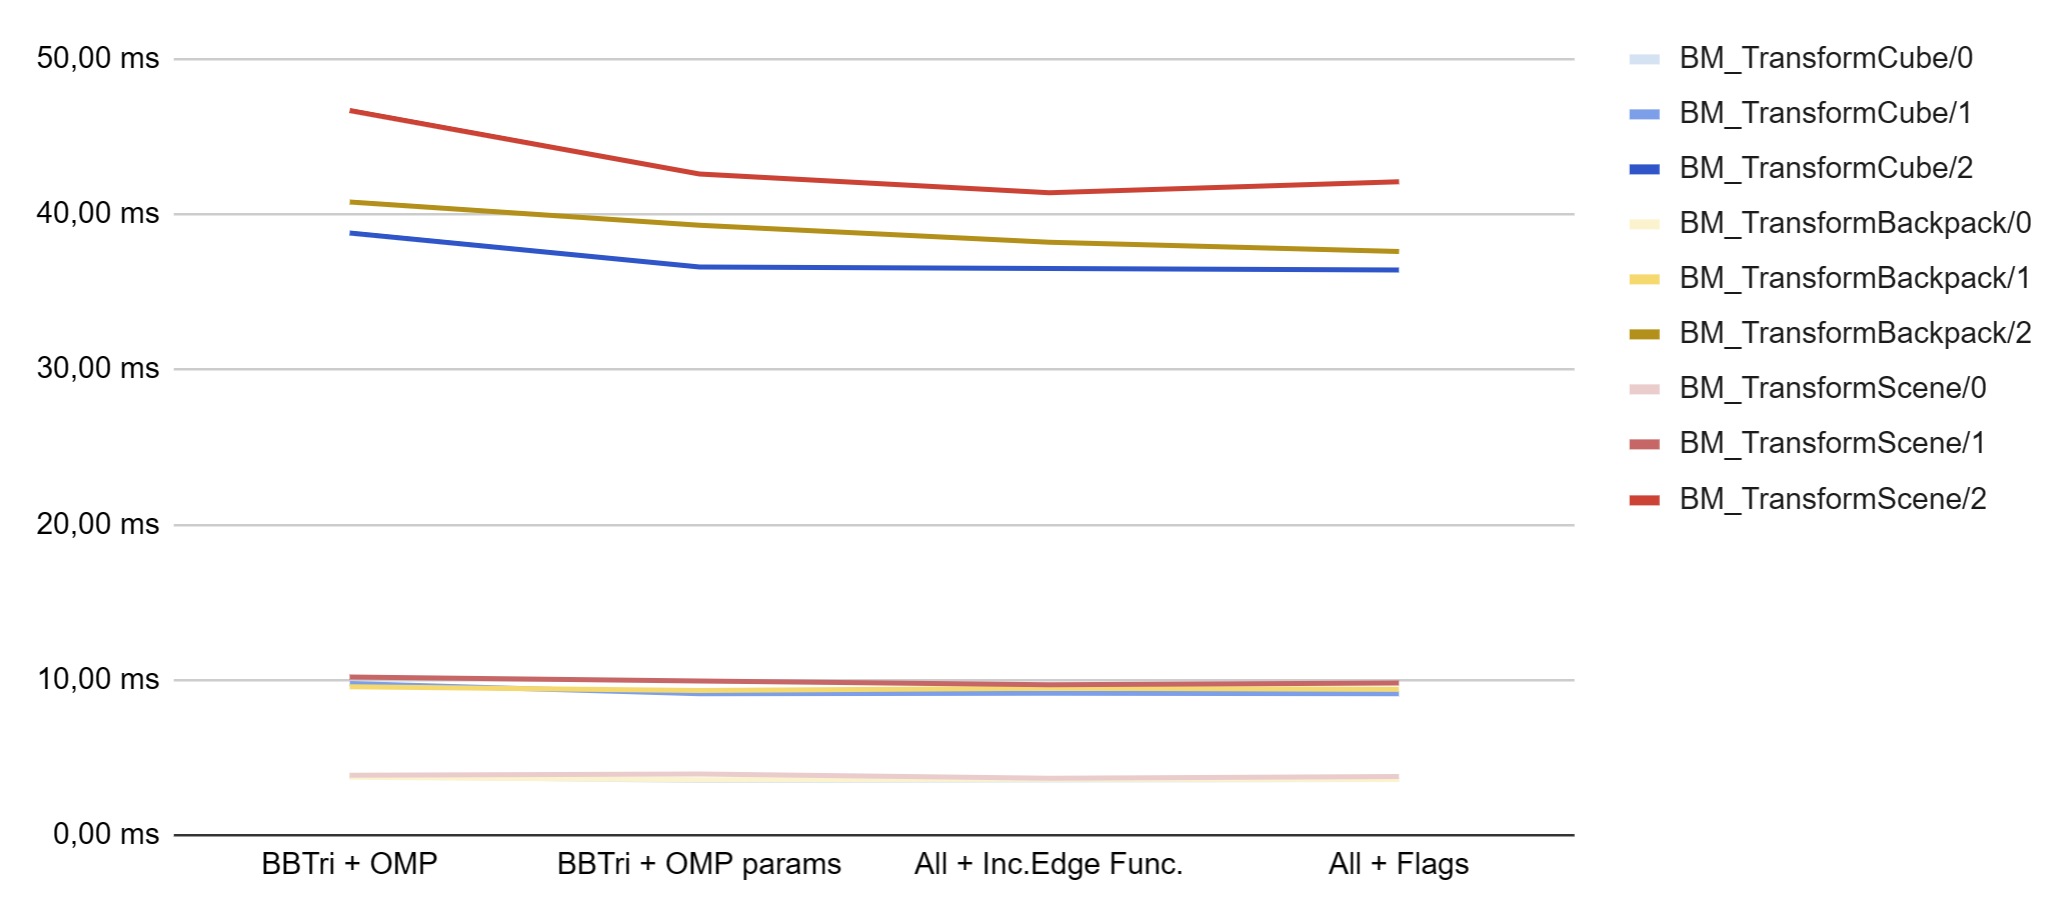
After looking up at all the possible ways of optimizing a rasterizer, I probably could have done much more but time was running out and I had to wrap up my project to deliver it on time. Nevertheless, I wanted to have a full overview of my work in each state of the program, with sensibly different objects and different resolutions. So, I did a benchmark for each state preceding the introduction of benchmarking to my project and assembled the values in a graph:
As you can see, if I use the benchmarks values for all states of optimization in my graph, we can bearly see anything except that the “BM_TransformBackpack/n” is already significantly impacted by the implementation of OpenMP and that the “BM_TransformScene/n” doesn’t even give values before that point. For those reasons, but also because basically the earlier stages of benchmarking weren’t initially intended, we are going to take them out of the graph.
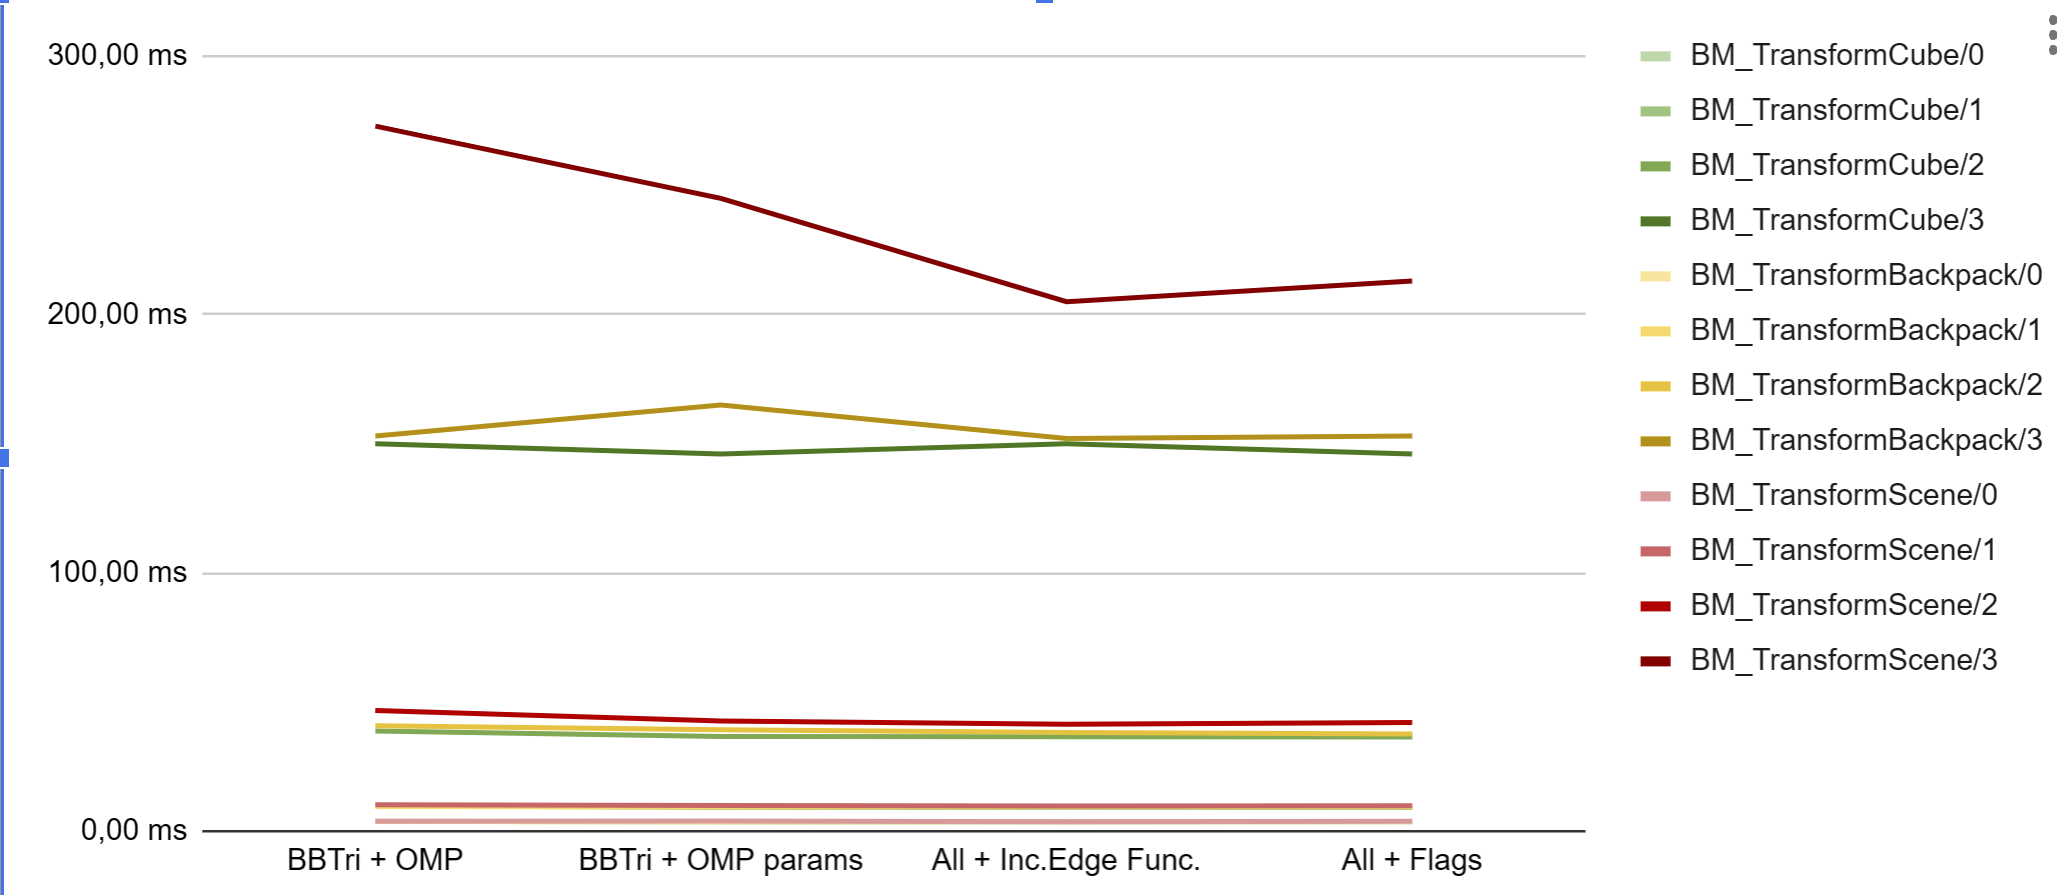
Here, we can see quite clearly that at high density of pixels and triangles the optimizations seem to be more effective. The problem is that the difference in scale makes it hard to read, so we are also going to take out the benchmarks running at improbable resolutions (BM_TransformObject/3) and we finally get a “readable” graph.
(Note that these benchmarks where run on a portable computer with a 6 Core Intel i7 9750H running at 2.6 GHz and 32 GB of RAM)
Conclusion
As we were able to see, each optimization has its little impact on the speed at which the rasterizer transforms objects. Throughout this experience, I was able to understand the importance of optimizing programs and get a really good insight about how to proceed.
To resume the journey, I went from a naive implementation of a rasterizer to a multithreaded version of it using OpenMP with specific parameters.
I implemented a simple algorithm to improve its efficiency (Bounding Box per Triangle) and then optimized that algorithm by integrating a slightly more complex one (Incremental Edge Function). And finally set some compiler flags to improve calculations speed.
All of that while keeping track of time with diverse tools such as std::chrono, Tracy and Benchmarks to finally output readable graphs that explicitly show improvements given to this rasterizer project.
The entire project can be found here.
